Gantt & time tracking#
Two features answer the two questions every team asks: when will it land? and where did the time go? The Gantt timeline turns start and due dates into a visual plan; time tracking records the effort actually spent, feeding the reports.
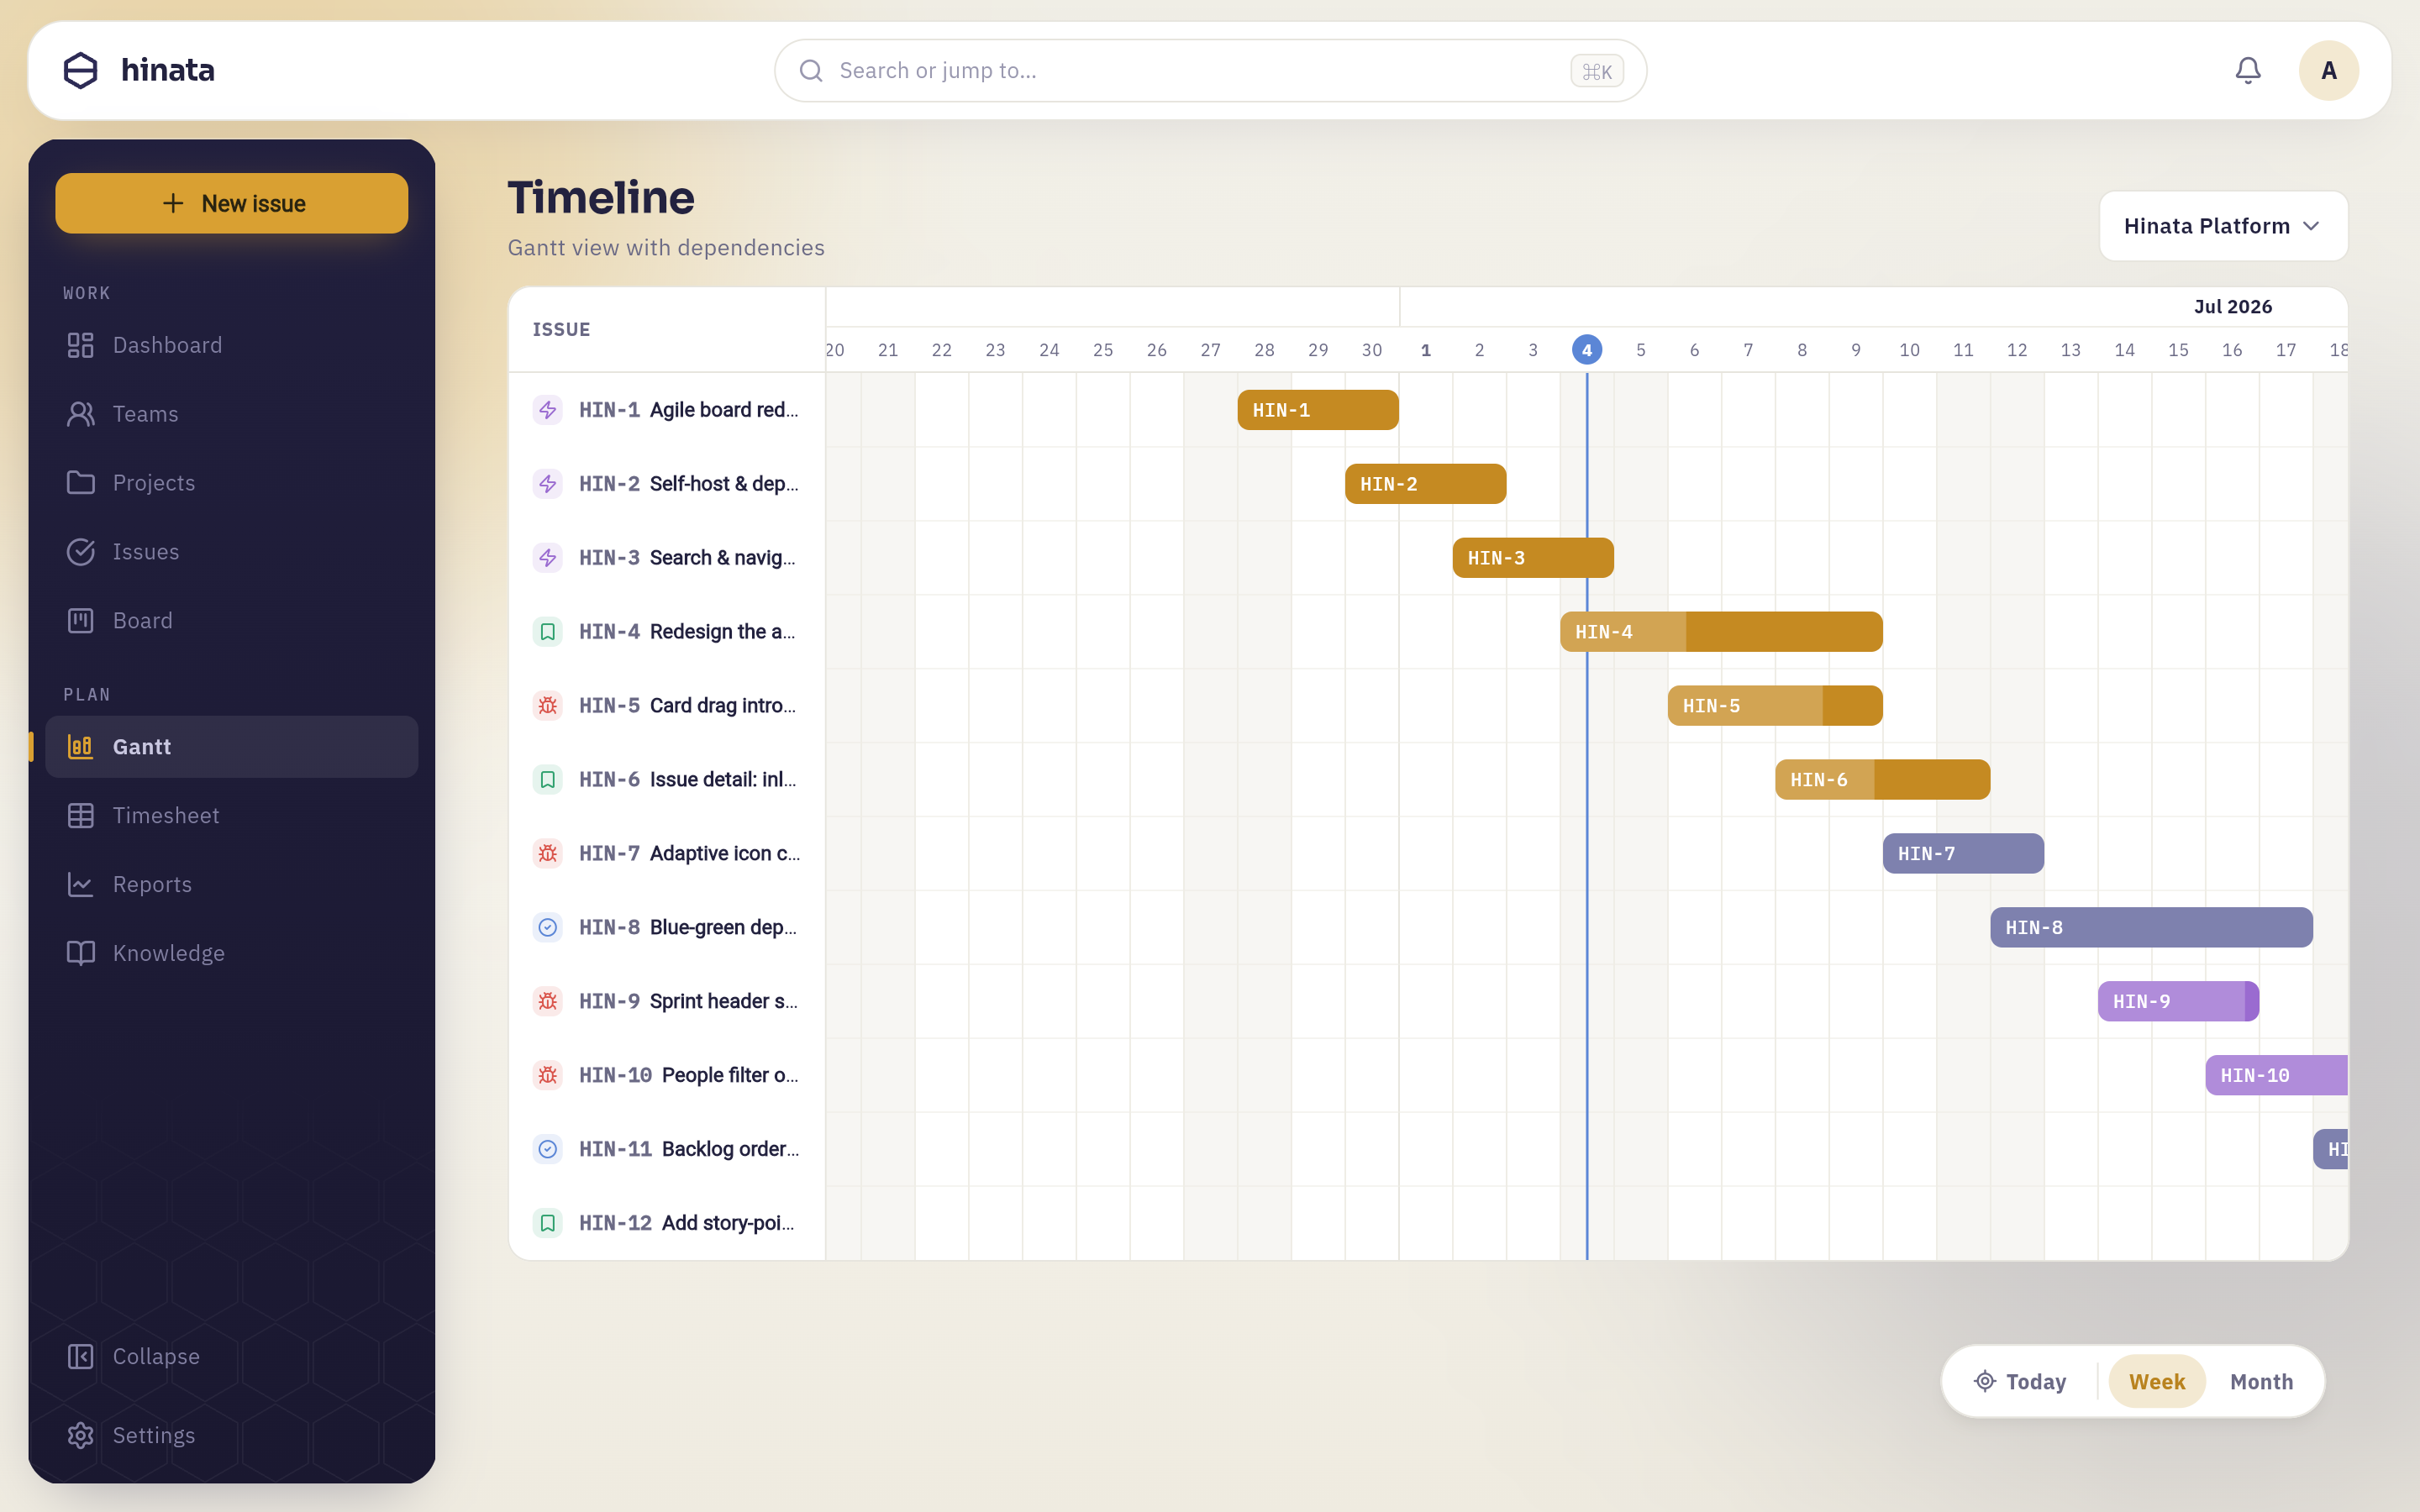 The Gantt timeline — start/due dates, dependencies and progress across the plan.
The Gantt / timeline#
The timeline is a read model built from your issues. Every issue with dates appears as a bar spanning its start date to its due date, positioned on a calendar so you can see overlaps, gaps and the critical path at a glance.
- Dependencies — links between issues are drawn as connectors, so a slip upstream visibly pushes everything downstream.
- Progress — each bar reflects how far along its issue is, giving an instant read on whether the plan is on track.
- Grouping — work is organized so you can follow a project, an epic or an assignee down the timeline.
Dates drive the timeline
A bar only appears once an issue has a start and/or due date. Set them on the issue detail view (see Issues); the timeline updates immediately.
Plan on the board, verify on the timeline
Use the board to organize what is in a sprint, and the timeline to sanity-check when it all has to happen and whether dependencies line up.
Time tracking#
Where the timeline is about the plan, time tracking is about reality. Anyone working an issue can log the effort they spent.
Logging work#
Open an issue and choose Log time. A work item captures:
- Duration — hours and minutes.
- Activity type — one of Development, Testing, Documentation, Design, Meeting or Support, so effort can be analysed by kind of work.
- Date — when the work happened (any day up to today).
- Note — an optional description of what you did.
Each issue shows spent vs. estimate, so it's obvious when something is running over.
Log time straight from a commit
With Git integration enabled, a smart-commit trailer logs work without leaving your editor: MOB-42 #time 2h 30m adds a 2½-hour work item to MOB-42.
Weekly timesheets#
Work items roll up into a weekly timesheet — a per-person, per-day grid of logged effort by activity. It's the quick way to review a week, spot gaps, and report time without spreadsheets.
Where the numbers go#
Logged time and estimates power the delivery metrics: capacity planning on sprints, and cycle-time and effort analysis in Reports.
Next steps#
- Set dates and dependencies on your issues.
- Read the delivery metrics in Reports & dashboard.
- Automate time logging with smart commits.