Timeline & dependencies
The timeline shows when work happens: bars on a calendar, with dependencies and warnings for scheduling conflicts.
It stores nothing of its own. Bars are an issue's start and due dates, arrows are links. Change those on the issue and the chart changes.
Open the timeline
- Gantt in the sidebar opens the Timeline page for one project. Pick the project in the top right. You only see projects you are a member of (see Projects & teams).
- The Timeline view on a Kanban board shows only that board's issues, with its filters (see Boards & sprints).
What you are looking at
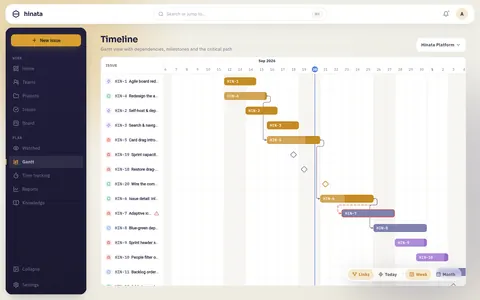
- Issue column on the left: type, key, title. Stays put while scrolling, click to open.
- Date axis at the top: months, plus days in Week zoom. Weekends are shaded.
- Today: circled and drawn as a vertical line. The chart scrolls there when it opens.
- Floating control bottom right: Links, Today, Week and Month. Icons only on a phone.
The chart scrolls sideways through time and down through issues.
Zoom between weeks and months
- Week: one column per day, key inside the bar. For day planning.
- Month: one column per month, no labels in bars. A year on one screen.
- Today jumps back at either zoom.
Rows are sorted by start date.
What puts an issue on the timeline
An issue of any type appears once it has a start date, a due date, or both, and is not archived. An empty timeline tells you what to do.
Set the dates
In the issue's Timeline card: Start date is the first day, Due date the last, inclusive.
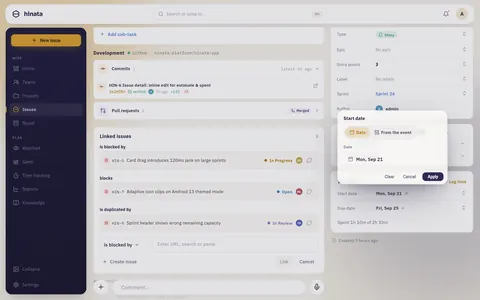
From the chart: long-press a bar or click the title on the left. The issue opens on top. Zoom and scroll position stay when you close it.
Two dates for work, one for a deadline
Set both dates for a stretch of work, only a due date for a deadline. See milestones.
Read a bar
- Length: start to due date, both included. Monday to Friday is five days.
- Colour: the workflow state, as on the board. Done issues get the resolved colour, so a finished plan turns green.
- Lighter fill: progress, meaning logged time against the estimate (2 of 4 hours is 50 %). Open issues cap at 99 %, only done reaches 100 %. No estimate means 0 %.
So an empty bar means "not started" or "not estimated". Logging time: Tracking your time.
Compare the fill with today
80 % full a third of the way in: estimate too small. Barely filled near the end: the work has not really started.
The hover tooltip shows key, state, percentage, relationships and a conflict warning.
Dates, estimates and story points are three different things
| What you set | What it means | Where it shows up |
|---|---|---|
| Start & due date | When the work happens | The bar on the timeline, the Due column, the red date when overdue |
| Estimate & logged time | How much effort it takes and has taken | Fill inside the bar, "spent of estimate" on the issue, timesheets |
| Story points | How big it is relatively | Sprint capacity, burndown, velocity, never the timeline |
| Sprint | Which timebox it belongs to | Board and backlog, never the timeline |
A due date on its own is a milestone
Due date but no start date: the issue is drawn as a diamond, outlined while open, filled when done. Good for a launch, handover or audit. Link the earlier work to it and arrows point at it.
Draw a dependency
A dependency: issue B cannot start until A is finished. On the chart it is a solid arrow from A's right end to B's left end.
- Open the issue, go to Linked issues.
- Add issue, pick is blocked by or blocks.
- Search issues (several allowed), Link.
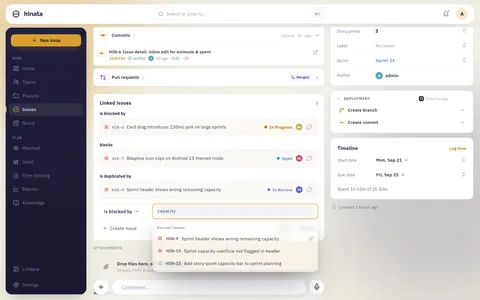
The link shows up on both issues and on the timeline at once.
Every relationship, and what the chart does with it
Only blocks sets order. All other types are faint dashes, hidden by default.
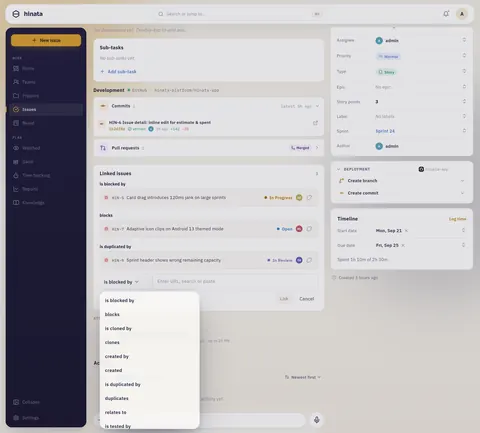
| Relationship | Reads as | On the timeline |
|---|---|---|
| Blocks | blocks / is blocked by | Solid arrow. Constrains the schedule, can conflict, counts toward the critical path |
| Relates | relates to (both ways) | Faint dash |
| Duplicates | duplicates / is duplicated by | Faint dash |
| Clones | clones / is cloned by | Faint dash |
| Tests | tests / is tested by | Faint dash |
| Splits | split to / split from | Faint dash |
| Creates | created / created by | Faint dash |
"HIN-12 is blocked by HIN-9" and "HIN-9 blocks HIN-12" are the same link.
Reserve blocking for real constraints
For a mere preferred order, use relates to. Otherwise you get pointless conflicts and a wrong critical path.
Both ends have to be on the chart
If the other issue has no dates or is in another project, there is no arrow. The link still exists.
Choose what gets drawn
Links opens three switches that apply right away. A popover on wide screens, a sheet from the bottom on phones.
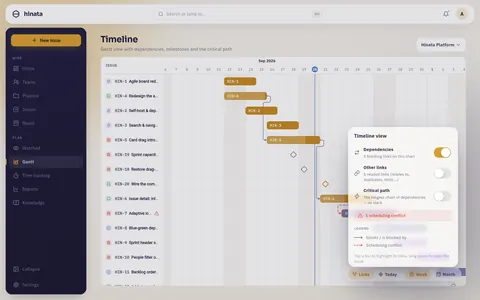
These switches are yours alone
They only change your view and reset when you leave the page.
When a plan cannot hold: conflicts
A conflict: the blocked issue starts on or before the day its blocker finishes.
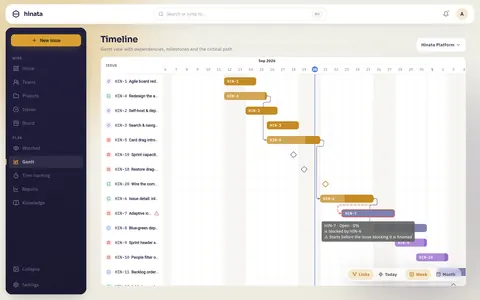
You see it as a red dashed arrow, a red outline, a warning triangle in the issue column and in the tooltip ("Starts before the issue blocking it is finished"). The Links panel counts conflicts.
Hinata does not fix them for you. Move the dates or remove the link.
The critical path
Critical path highlights the longest chain of blocking dependencies, measured in days.
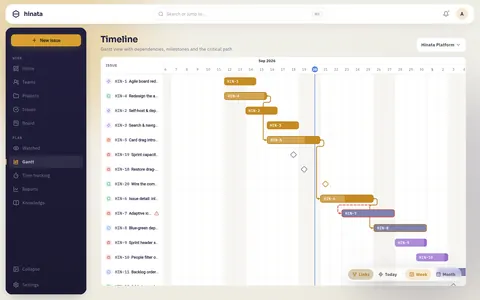
These issues have no slack. If one slips a day, the end of the chain slips too. Extra hands help most here.
The path is only as good as the links
It only knows blocking links between dated issues on this chart.
Focus one issue
| Do this | And you get |
|---|---|
| Click or tap a bar | Pins that issue. It and its linked neighbours stay bright, the rest dim |
| Click or tap it again | Clears the pin |
| Click or tap empty grid | Also clears the pin |
| Hover a bar | Tooltip with key, state, progress, relationships and conflict |
| Long-press or double-click a bar | Opens the issue |
| Click a title in the left-hand column | Opens the issue |
| Drag the chart | Scrolls through time or issues |
The issue opens over the timeline. Afterwards project, zoom and scroll position are unchanged.
The board's Timeline view
Same as this page, but with the board's issues and filters. Differences: issues without dates are listed below the grid, and sub-tasks are left off.
Plan a release, start to finish
- Milestone: an issue Release 2.4 ships with only a due date.
- Dates: give every required issue a start and a due date.
- Dependencies: add is blocked by where something must wait. Link the last piece of work to the milestone.
- Conflicts: check the count in Links and fix each one.
- Critical path: issues on it with no owner, or with an overloaded owner, are your risk.
- Month zoom: a wall of bars in the final week points to optimistic estimates.
- Come back regularly: the chart updates on its own.
Why isn't my issue on the timeline?
- It has no dates (most common cause).
- It is archived.
- Another project is selected in the top right.
- It is a sub-task and you are on a board's Timeline.
- A board filter is hiding it.
If only an arrow is missing, the other issue usually has no dates.
What the timeline will not do
- Drag bars: not possible. Edit dates on the issue, where they go into the history and watchers are notified.
- Several projects: only through a shared board and its Timeline.
- Plan automatically: Hinata does not level workloads, move dates or derive dates from estimates.
Where to go next
- Working with issues: dates, links, hierarchy
- Boards & sprints: work by state, the board's Timeline
- Tracking your time: logging effort for progress
- Reports & dashboard: plan against reality