Boards & sprints
Every project has an agile board. Its columns are your own workflow states. If you work in timeboxes, you also plan sprints.
Two kinds of board
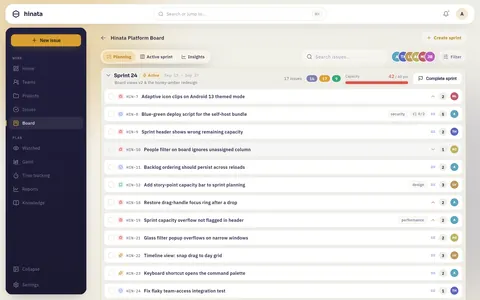
Kanban is a continuous flow board. Scrum is built around sprints and has Planning, Active sprint and Insights tabs. Cards, filters and swimlanes work the same on both.
The board
Each column maps to one or more workflow states. It shows a colored dot, its name and a count badge.
- Cards are your issues.
- Epics are never cards. They act as swimlane headers and filters.
- Sub-tasks only appear as cards when you group by sub-task.
Moving issues
- Desktop: drag a card to another column. The issue gets that column's first state. The target column highlights in amber.
- Phone and tablet: cards are tap-only. Open the issue and change its state in the detail sheet.
Either way, the board updates live.
WIP limits
A column can have a work-in-progress (WIP) limit. The badge then reads 3/5 (current / limit). When the column goes over its limit, the badge turns red.
WIP limits are configured server-side
The app only displays WIP limits. They belong to the column configuration, see Project settings.
Views
A Kanban board has a Board / Timeline switcher. It shows the same issues as a board or as a timeline. On desktop it's a segmented control, on a phone a compact switcher.
The Backlog is a Scrum concept and has its own tab on Scrum boards.
Filtering
Open the Filter popup to narrow the board. A badge counts the active criteria. You can filter by:
Status · Assignee · Priority · Type · Epic · Sprint · Author · Label
- Facets combine with AND, values within a facet with OR. Example: "Bug OR Story" that are also "assigned to Ana."
- The Sprint facet has a No sprint option for backlog items.
- The People strip of avatars above the board is a quick assignee filter.
- Clear all resets everything.
Swimlanes
Use Group by to split the board into horizontal swimlanes:
| Group by | Lanes | Catch-all lane |
|---|---|---|
| None | A single flat board | (none) |
| Epic | One lane per epic | No epic |
| Assignee | One lane per person | Unassigned |
| Sub-task | Group work items with their sub-tasks | Stand-alone |
Combined with the Epic filter, the board shows just one epic and its tree. Handy for an epic-focused standup.
The backlog
The backlog holds every issue in the project with no sprint, sorted by priority. Everything stays here until you pull it into a sprint.
Running a sprint
Scrum boards have three tabs: Planning, Active sprint and Insights. A sprint runs in three steps.
1. Plan
In the Planning tab, choose Create sprint and set:
- Sprint name: prefilled with the next number, e.g.
Sprint 3. Editable. - Sprint goal: optional. What the sprint should deliver.
- Duration: 1 to 4 weeks (default 2). The end date is computed from the start date.
- Start date: when the timebox begins.
Then fill the sprint:
- Drag issues from the Backlog into the sprint. On touch, multi-select and use Move to….
- Estimate issues with story points via planning poker on the Fibonacci scale.
- The capacity bar shows
committed / capacity ptsand turns red if you over-commit. - Point buckets show how the points split across to-do, in progress and done.
2. Start
Press Start sprint on the sprint. The button is disabled while the sprint is empty.
The dialog locks the scope and shows the issue count and committed story points. If you're above the target, an over-capacity warning appears. Confirm goal and duration, and the sprint becomes Active.
The Active sprint tab now shows the running board. At the top you see an amber Active badge, the sprint name and goal, and a progress bar like Day 4/14.
3. Complete
When the timebox ends, press Complete sprint. The dialog shows:
- Completed: story points done, with a percentage.
- Not completed: points still open.
- Where unfinished work goes: carry open issues over into another planned sprint, or return them to the backlog.
Confirm, and the sprint closes. Open issues land where you chose.
Nothing is lost at sprint boundaries
Completing a sprint never deletes work. Every open issue moves to the next sprint or back to the backlog.
Insights & burndown
The Insights tab shows the sprint as charts:
- Sprint burndown: a dashed Guideline (ideal path from committed points to zero) and a solid Actual line up to today. The y-axis starts at the points committed when the sprint began.
- Velocity: committed and done points, plus an average across sprints.
- Work breakdown by assignee and Scope changes: net points added or removed since the sprint started.
For velocity trends, cycle time, distributions and PDF export across sprints, see Reports & dashboard.
Related pages
- Issues & hierarchy: the cards on your board and how they nest.
- Project settings: the workflow states behind your columns.
- Gantt & time tracking: the timeline view and logging work.
- Reports & dashboard: velocity, burndown history and exports.