Timeline & dependencies#
The timeline answers a question a board cannot: when. A board tells you what state everything is in; the timeline lays the same work out on a calendar, draws the links between the pieces, and shows you where two of them have been promised at the same time.
The most important thing to know before you start is that the timeline stores nothing of its own. Every bar is an issue's start and due date. Every connector is a link between two issues. Change a date on an issue and the bar moves; remove a link and the arrow disappears. There is no separate plan to keep in sync — which is exactly why the picture can be trusted.
Open the timeline#
Choose Gantt in the sidebar. The page is headed Timeline, with a project picker in the top-right: the chart shows one project at a time.
You will only find the projects you are a member of in that picker. If a project you expect is missing, that is a matter of project or team membership rather than anything to do with the timeline — Projects & teams explains how access works.
There is a second way in. On a Kanban board, the Timeline view lays out the issues that are on that board — filtered exactly as you have filtered the board. The two charts read identically; they simply start from different sets of issues. See Boards & sprints for the board switcher.
Which one to reach for: the Gantt page when you want the whole project, including work no board covers; the board's Timeline when you want the slice you have already narrowed down.
What you are looking at#
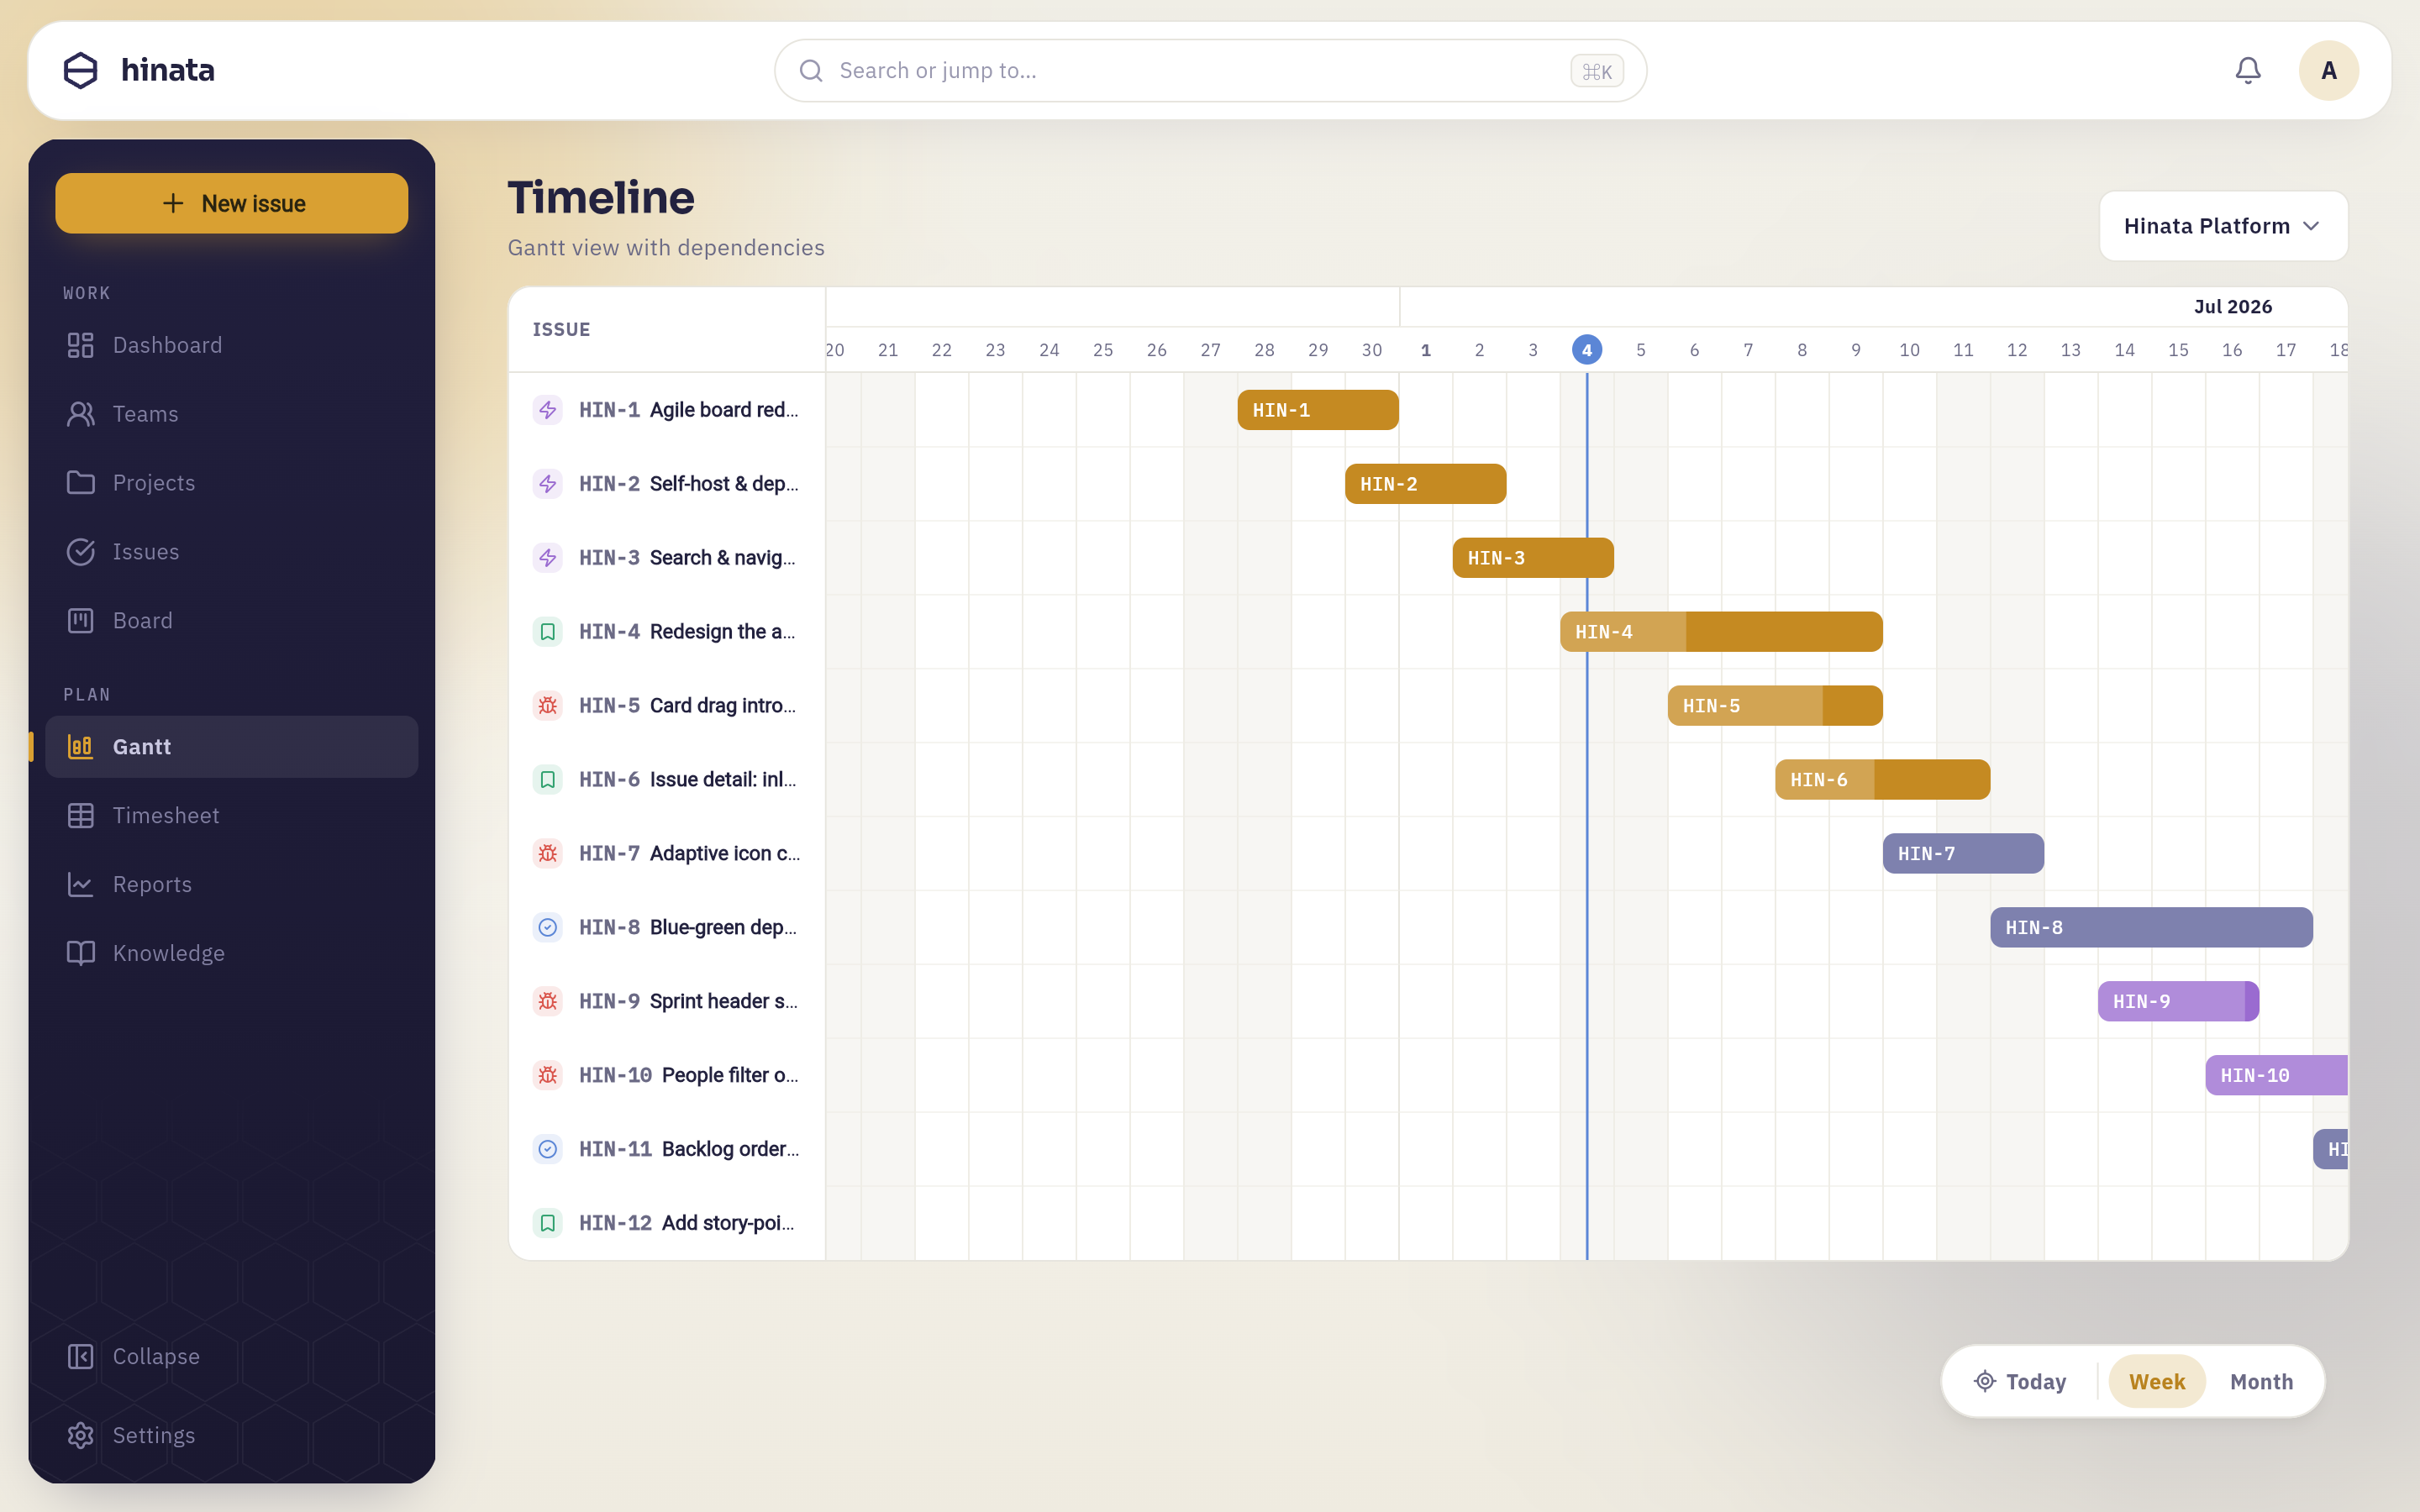 The Timeline page. On the left, a frozen column of issues — type, key and title. Along the top, the month and its day numbers, with today (the 21st) circled in blue and a blue line running down the whole chart. Milestones are diamonds; the red pair mid-chart is a scheduling conflict. Bottom right, the floating control: Links, Today, Week and Month.
Four parts, each doing one job:
- The issue column on the left is frozen — it stays put while the chart scrolls sideways, so you never lose track of which row you are reading. Click a title to open that issue.
- The date axis across the top shows the month band, and in Week zoom the individual day numbers underneath it. Weekends are shaded so a week reads as a week.
- Today is marked twice: circled in the axis and drawn as a vertical line down the chart. When you open the timeline it scrolls to centre on today, because that is nearly always where you want to start.
- The floating control in the bottom-right holds Links (which connectors to draw), Today (scroll back to now), and the Week / Month zoom. Week gives you day-level detail; Month compresses several quarters into one screen for a long-range look.
Both directions scroll
The chart scrolls sideways through time and downwards through issues, and the axis and the issue column follow along. On a phone the floating control shrinks to icons to leave the chart every pixel it can get.
Zoom between weeks and months#
The two zoom levels are not just bigger and smaller — they are for different questions.
Week is the working zoom. Every day gets its own column, weekends are shaded, and each bar carries its issue key inside it. Use it when you are deciding what happens on which day, checking whether two people are booked against each other, or reading the chart out loud in a planning session.
Month compresses each month into a single column. Individual days disappear and so do the labels inside the bars, but a year of work fits on one screen. Use it to see the shape of a plan: where the crowded quarter is, whether the milestones are evenly spread, how far the last bar actually reaches.
Today takes you back to now at either zoom, which is the quickest way to recover after scrolling off into next spring.
Rows are sorted by start date, so the chart reads roughly top-left to bottom-right the way a Gantt chart is meant to.
What puts an issue on the timeline#
An issue appears as soon as it has a start date, a due date, or both, and has not been archived. That is the whole rule. Every type qualifies — epics, stories, tasks, bugs, features and sub-tasks alike — as long as it carries a date.
An issue with no dates is not on the chart. That is not an error; it means nobody has said when it happens yet. If the timeline is empty it tells you so, and tells you what to do about it.
Set the dates#
Open the issue and find the Timeline card. Start date is the first day the work covers, Due date the last day it covers, inclusive.
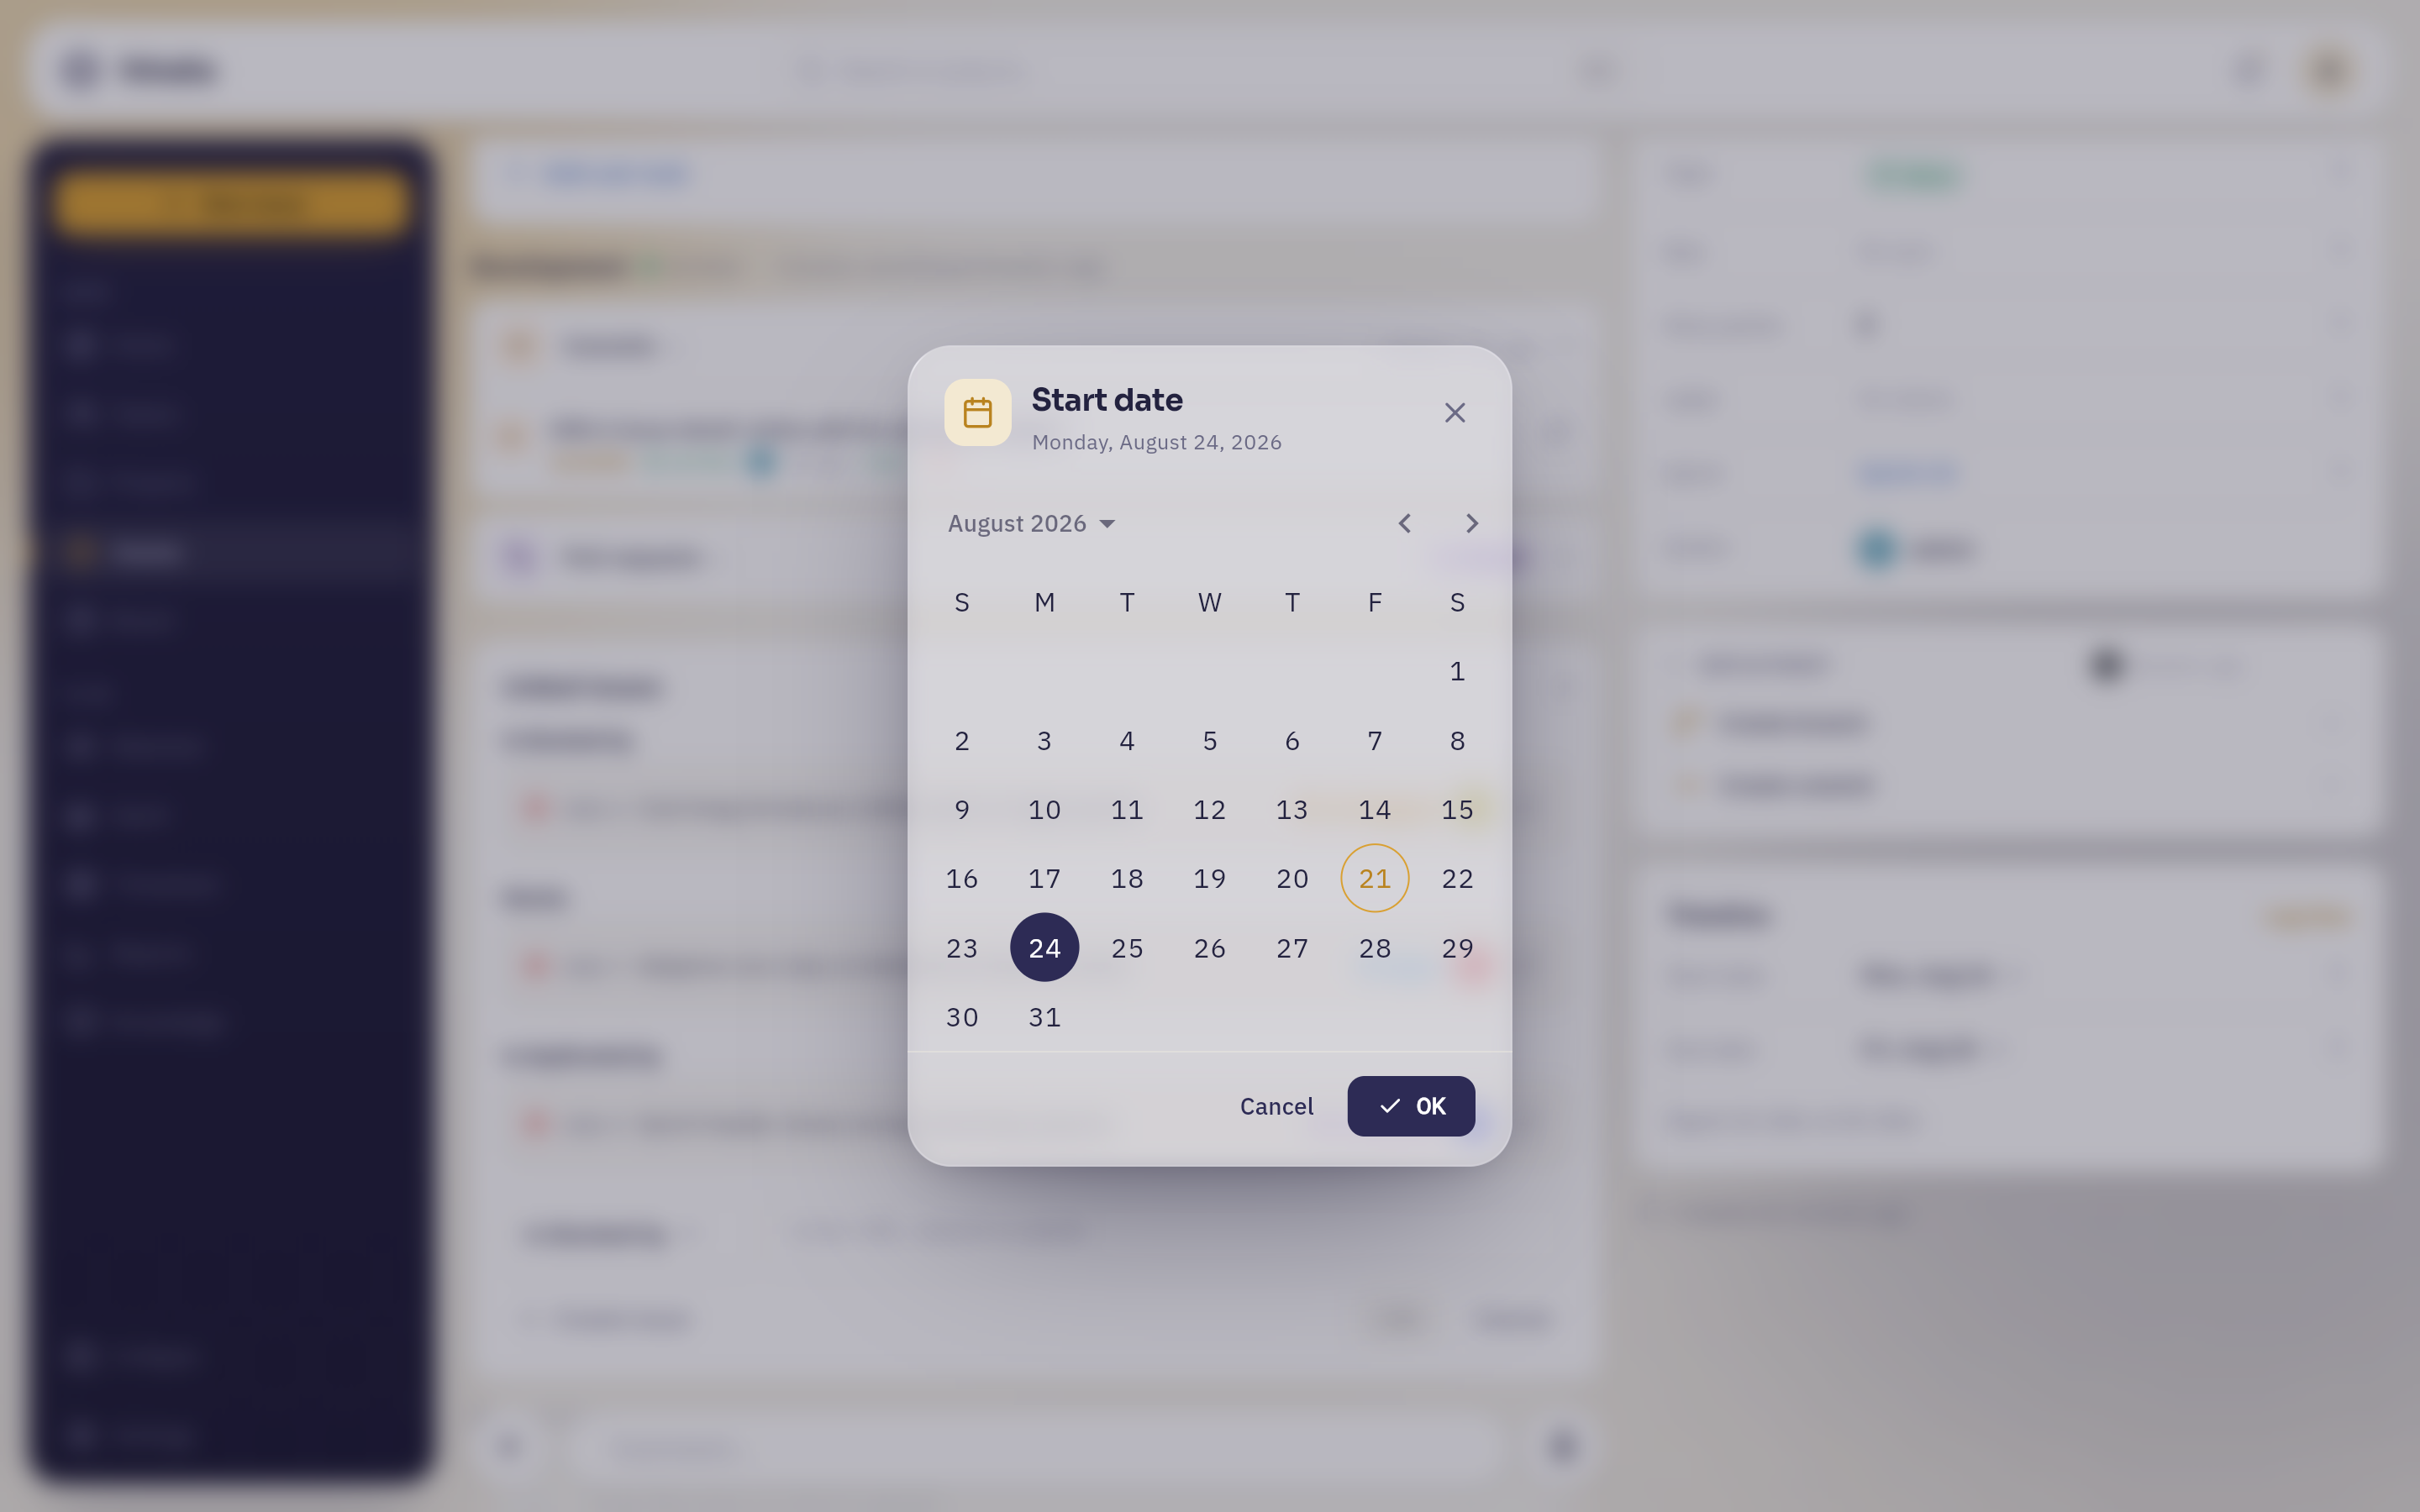 Tapping the Start date row opens a month calendar: today ringed, the issue's current start date filled in, Cancel leaving the date as it was. The small × on the row itself — behind the dialog here — clears the date outright without opening this picker, so aim for the label rather than the middle of the row.
You can do this straight from the chart: long-press a bar (or click the issue's title in the left-hand column) and the issue opens over the timeline. Set a date, close it again, and the chart is redrawn with your scroll position and zoom exactly where you left them.
Two dates for work, one for a deadline
Give an issue both dates when it occupies a stretch of time. Give it only a due date when it is a moment rather than a stretch — see milestones below.
Read a bar#
A bar runs from the issue's start date to its due date, both days included, so a Monday-to-Friday issue is five days wide.
The colour is the issue's workflow state — the same colour as its column on the board and its status chip on the issue. Once the issue reaches a state your project counts as done, the bar switches to the resolved colour, so a finished plan visibly turns green from left to right.
The lighter fill from the left edge is progress. It is worth knowing where that number comes from, because it is not a slider anyone drags:
- Progress is logged time against the estimate. Two hours logged on a four-hour estimate is 50 %.
- It is capped at 99 % while the issue is open, however much time has been logged. Only reaching a done state takes it to 100 %.
- An issue with no estimate shows 0 %, no matter how much work has gone into it.
So an empty bar can mean "not started" or it can mean "nobody estimated this". Both are worth knowing, and neither is a bug. Logging effort is covered in Tracking your time.
A bar that is fuller than the calendar is a warning
Compare the fill against where today's line crosses the bar. A bar that is 80 % full a third of the way through its span means the estimate was too small; one that is barely filled with two days to run means the work has not really started. Neither shows up in a list of statuses — it is the single most useful thing the chart tells you for free.
In Week zoom the issue key is printed inside the bar, so a screenshot of the chart is still readable. Hover a bar and a tooltip gives you the key, the state, the percentage, every relationship this issue has on the chart, and a warning if its schedule conflicts.
Dates, estimates and story points are three different things#
They are easy to confuse, and the timeline only cares about one of them. It is worth pinning down which number does what:
| What you set | What it means | Where it shows up |
|---|---|---|
| Start & due date | When the work happens | The bar on the timeline, the Due column in issue lists, the red date on an overdue card |
| Estimate & logged time | How much effort it takes and has taken | The progress fill inside the bar, "spent of estimate" on the issue, timesheets |
| Story points | How big it is relative to other work | Sprint capacity, burndown and velocity — never the timeline |
| Sprint | Which timebox it belongs to | The board and the backlog — also never the timeline |
An issue can be in a sprint with eight story points and still be absent from the timeline, because nobody gave it dates. The reverse is just as possible. Neither is wrong; they are answers to different questions, and you only need the ones your team actually uses.
A due date on its own is a milestone#
An issue that has a due date but no start date has no length — it is a deadline, not a stretch of work. The timeline draws it the way every Gantt chart does: as a diamond on that one day, outlined while the issue is open and filled once it is done.
Use them for the fixed points a plan hangs off: a launch, a hand-over, an audit, the day the venue is booked. Because a milestone is an ordinary issue, it can be assigned, discussed, watched and — most usefully — linked, so everything that has to happen before it can be drawn as pointing at it.
Draw a dependency#
A dependency is one issue blocking another: the second one cannot start until the first is finished. On the chart it is a solid connector out of the blocker's right edge, with an arrowhead pointing into the blocked issue's left edge.
To create one, open the issue and go to the Linked issues section.
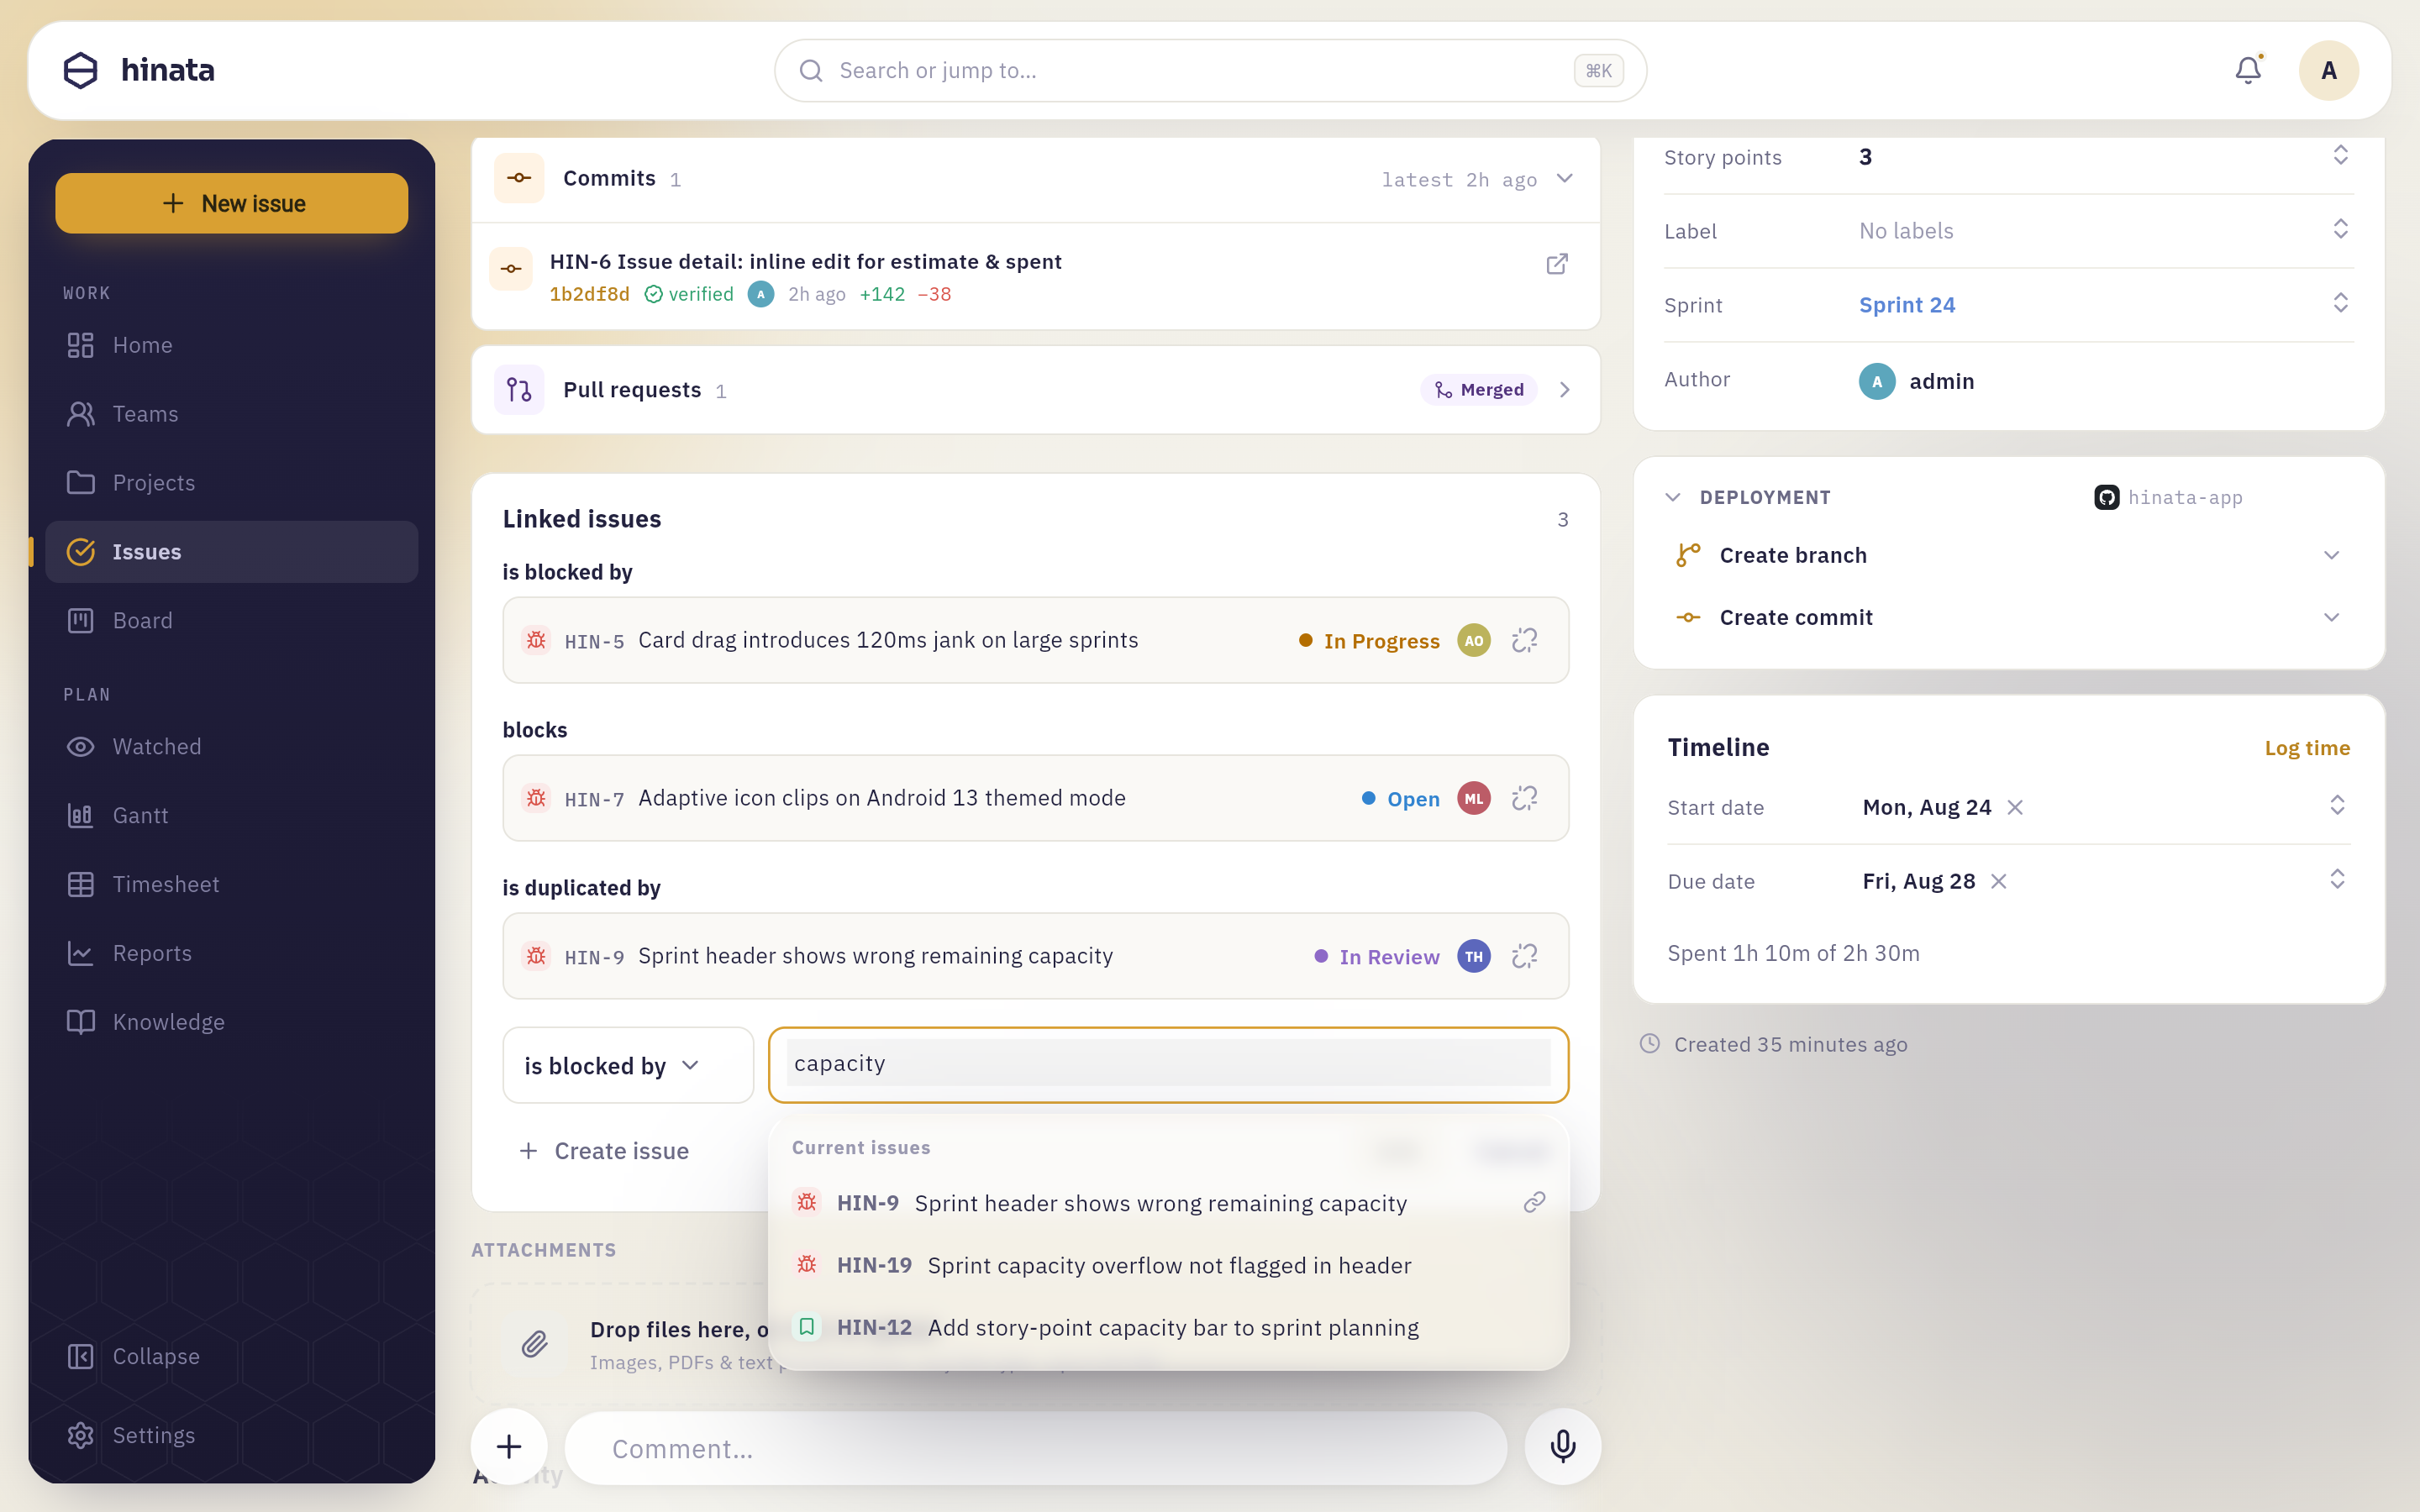 Add issue opens a composer below the links the issue already has: the relationship on the left, a search field on the right. Typing "capacity" matches on title as well as key and lists HIN-9, HIN-19 and HIN-12 under Current issues. Link confirms, Cancel backs out.
is blocked by and blocks are the two relationships that constrain a schedule; the rest are covered below. You can pick several issues before confirming.
The link appears immediately on both issues — the other one shows the same relationship phrased from its own side — and the connector appears on the timeline.
Every relationship, and what the chart does with it#
Only one of the seven relationship types says anything about order. The rest say how issues belong together, which is useful on the issue and mostly noise on a calendar — so the timeline draws them as faint dashes and leaves them switched off until you ask.
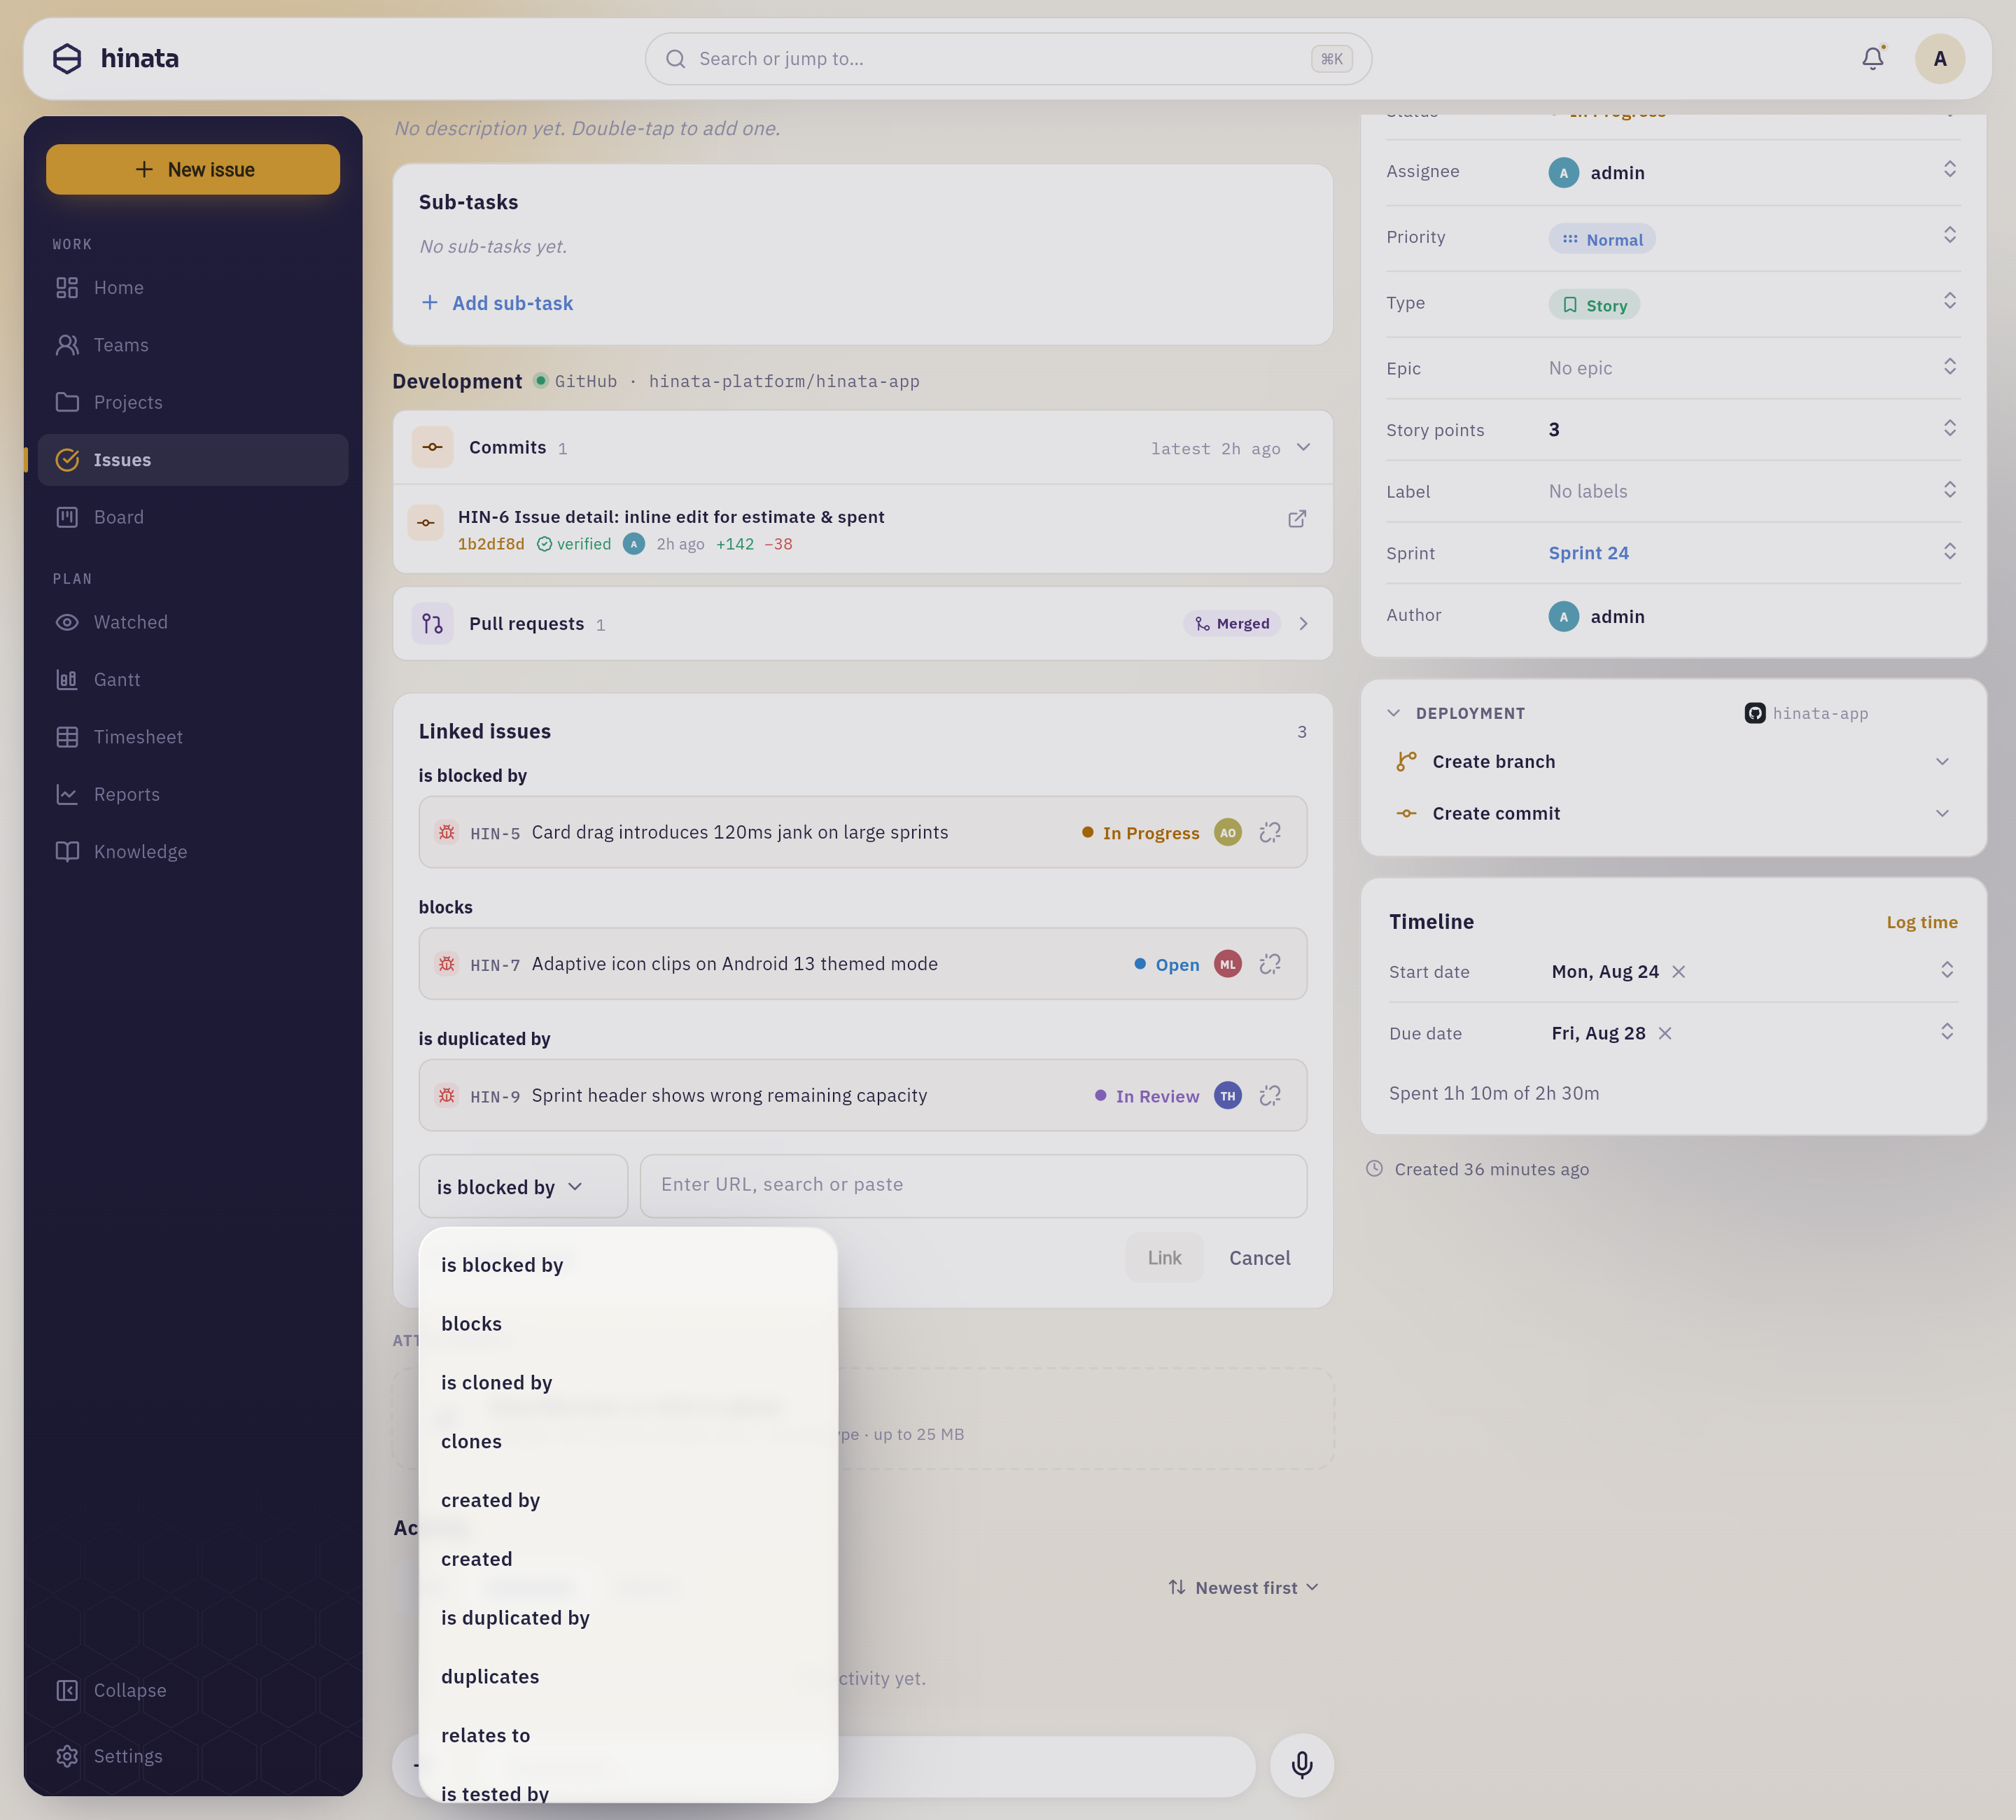 The relationship dropdown. Both directions of a type are separate entries — is blocked by and blocks, is cloned by and clones — because you phrase a link from the issue you have open. The list scrolls; split from and split to sit below the fold.
| Relationship | Reads as | On the timeline |
|---|---|---|
| Blocks | blocks / is blocked by | Solid arrow. Constrains the schedule, can conflict, counts toward the critical path |
| Relates | relates to (both ways) | Faint dash |
| Duplicates | duplicates / is duplicated by | Faint dash |
| Clones | clones / is cloned by | Faint dash |
| Tests | tests / is tested by | Faint dash |
| Splits | split to / split from | Faint dash |
| Creates | created / created by | Faint dash |
Direction matters for all of them except relates to, which reads the same from both ends. Pick the phrasing from the issue you happen to have open — "HIN-12 is blocked by HIN-9" and "HIN-9 blocks HIN-12" create exactly the same link.
Reserve blocking for real constraints
It is tempting to use blocks for "we should probably do this one first". Don't — it is the one relationship the chart takes seriously, and a plan full of soft blocks produces conflicts nobody intends to fix and a critical path that means nothing. If the order is a preference, use relates to and put the reasoning in a comment.
Both ends have to be on the chart
A connector needs two bars to run between. If you link an issue to one that has no dates — or to one in another project — nothing is drawn, because there is nowhere for the arrow to land. The link still exists on both issues; it just has no line. If a dependency you expected is missing, check the other issue's dates first.
Choose what gets drawn#
The Links button on the floating control opens the timeline's view options.
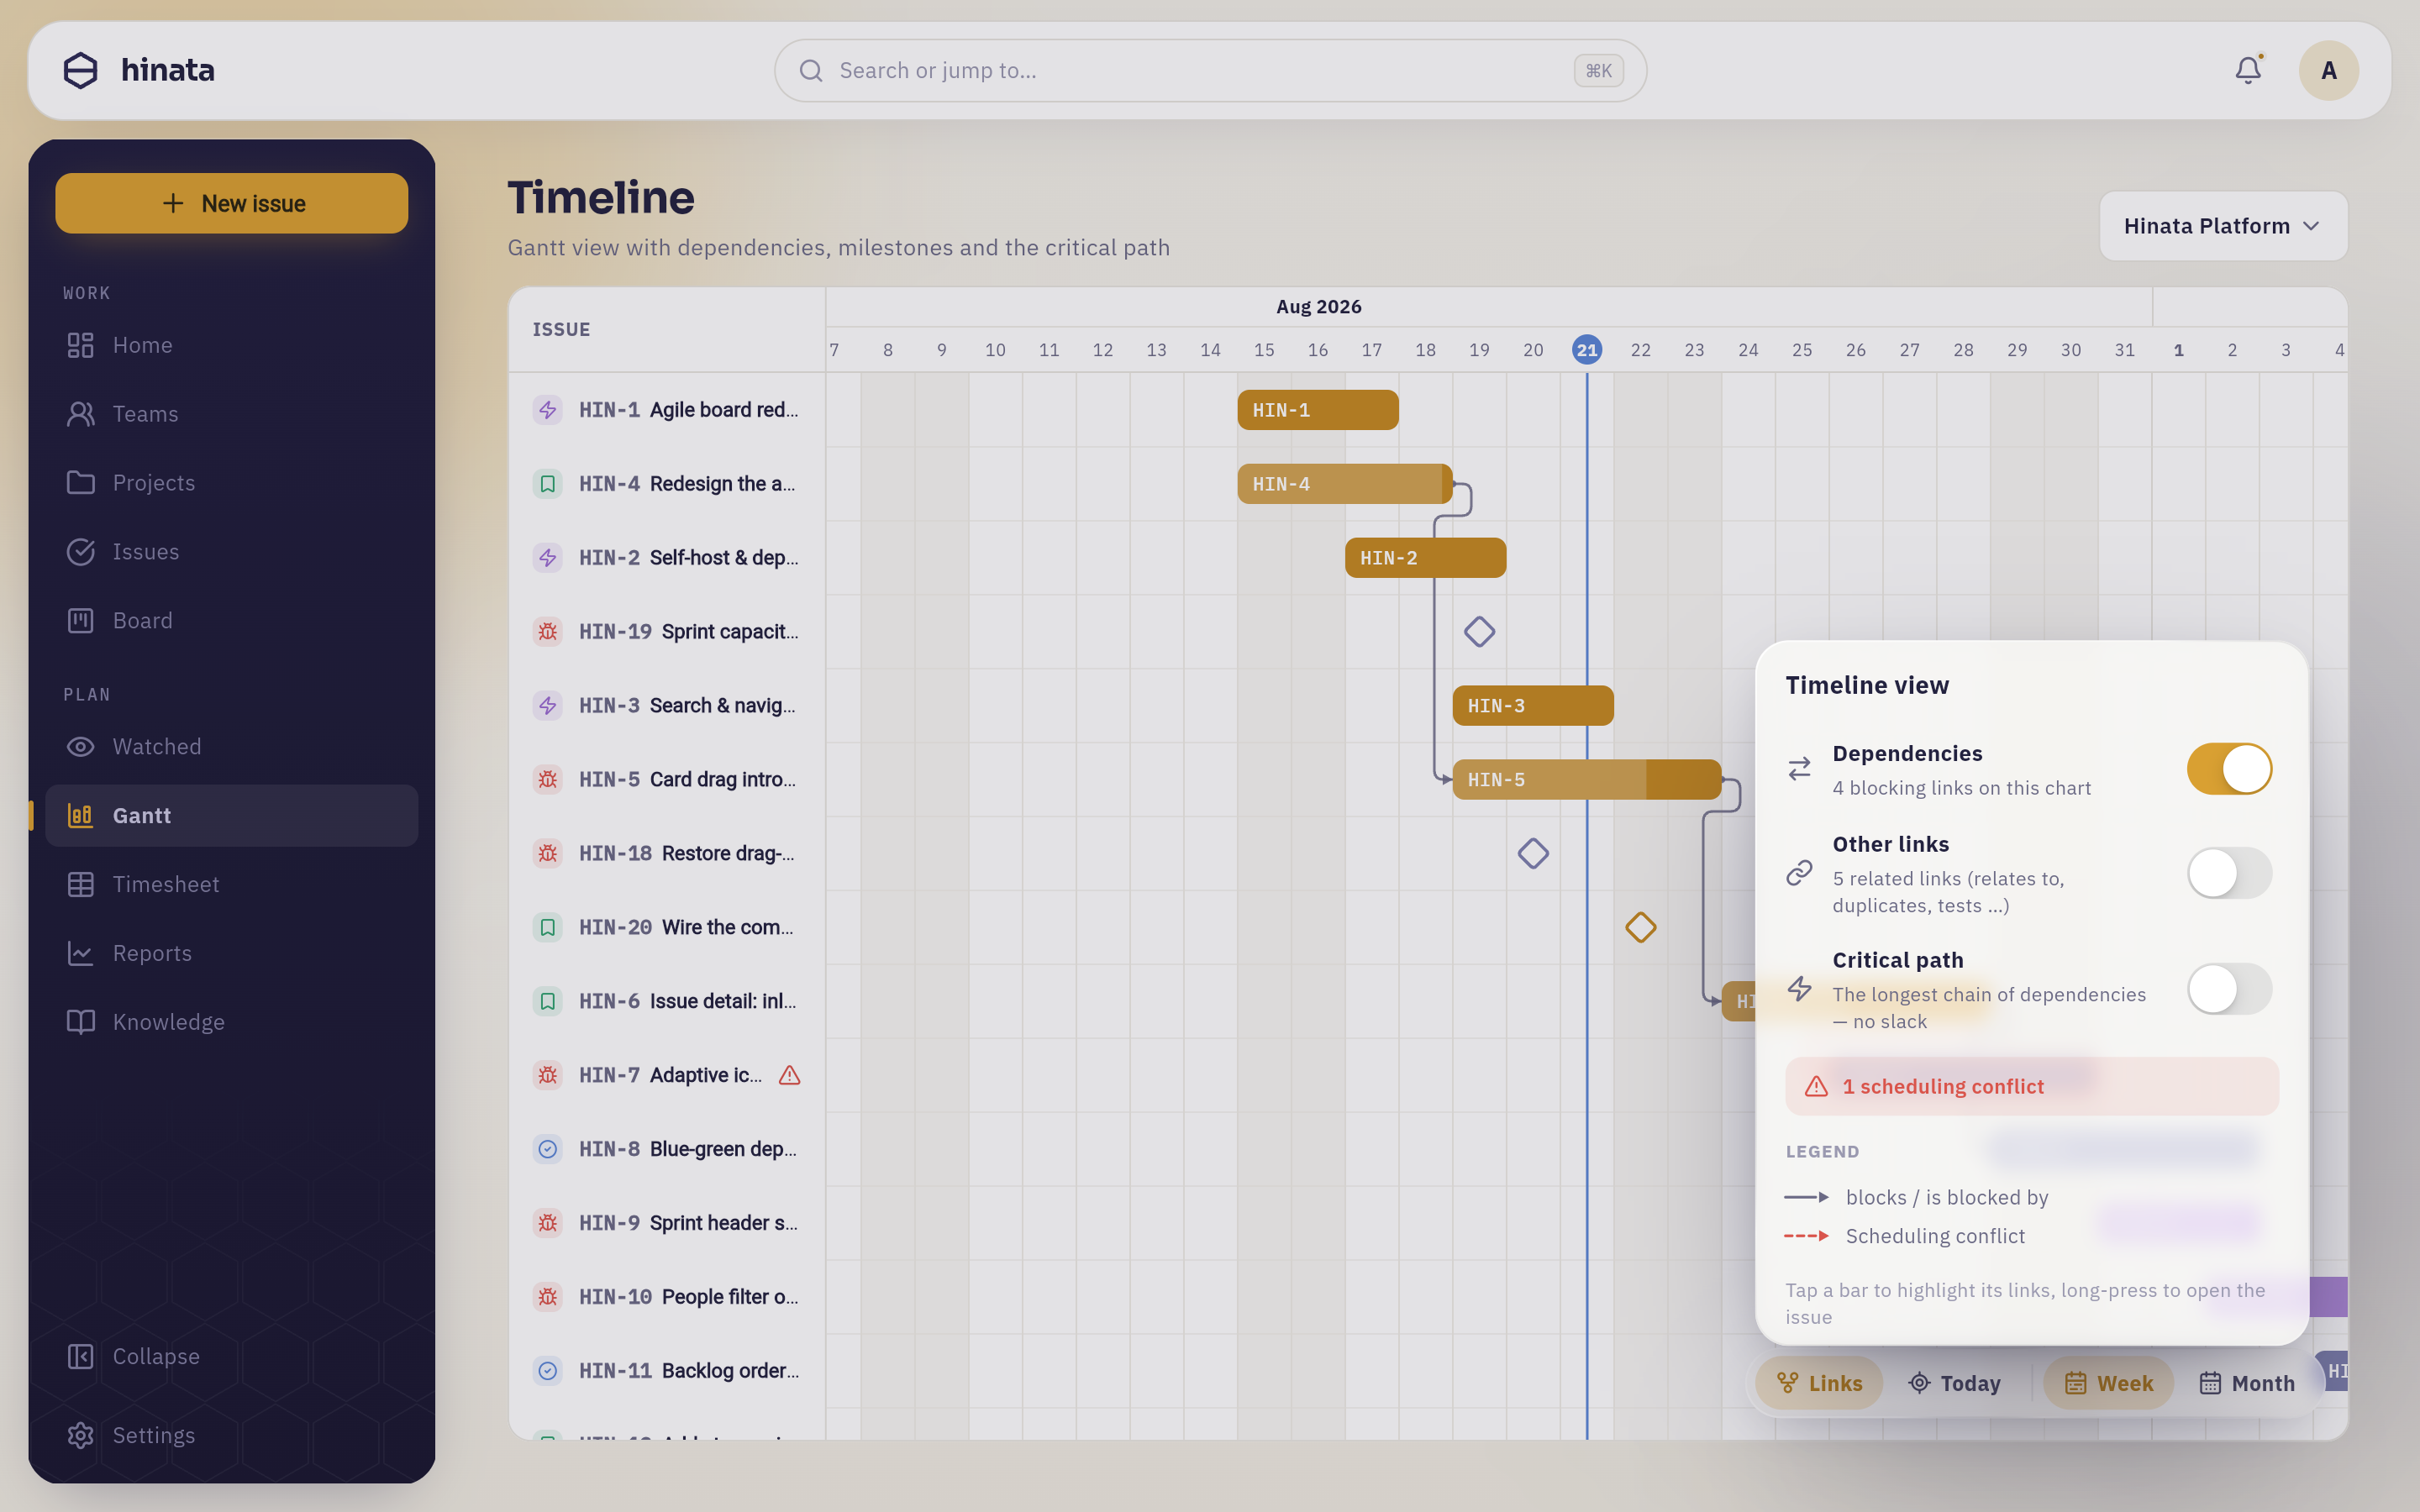 Dependencies on, Other links off, Critical path off — three switches, each applying live. Every row counts what this chart actually holds, 4 blocking links against 5 related ones, so you can see whether turning one on will change anything before you do it; "0 blocking links on this chart" is a useful answer in itself. Below them the red conflict bar and a legend for the line styles.
On a wide screen the panel opens as a popover beside the button; on a phone it slides up from the bottom. There is nothing to confirm — every switch takes effect as you flip it.
These switches are yours, and they are temporary
Turning on the critical path changes what you see, not what anyone else sees, and nothing about the project is modified. The choices also reset when you leave the page, so the timeline always opens in its plainest, most readable state.
When a plan cannot hold: conflicts#
A conflict is a dependency whose dates contradict it: the blocked issue is scheduled to start on or before the day its blocker finishes.
It is the kind of contradiction that survives every status meeting until somebody draws it, so the timeline is loud about it — a quiet conflict is a missed deadline three weeks later.
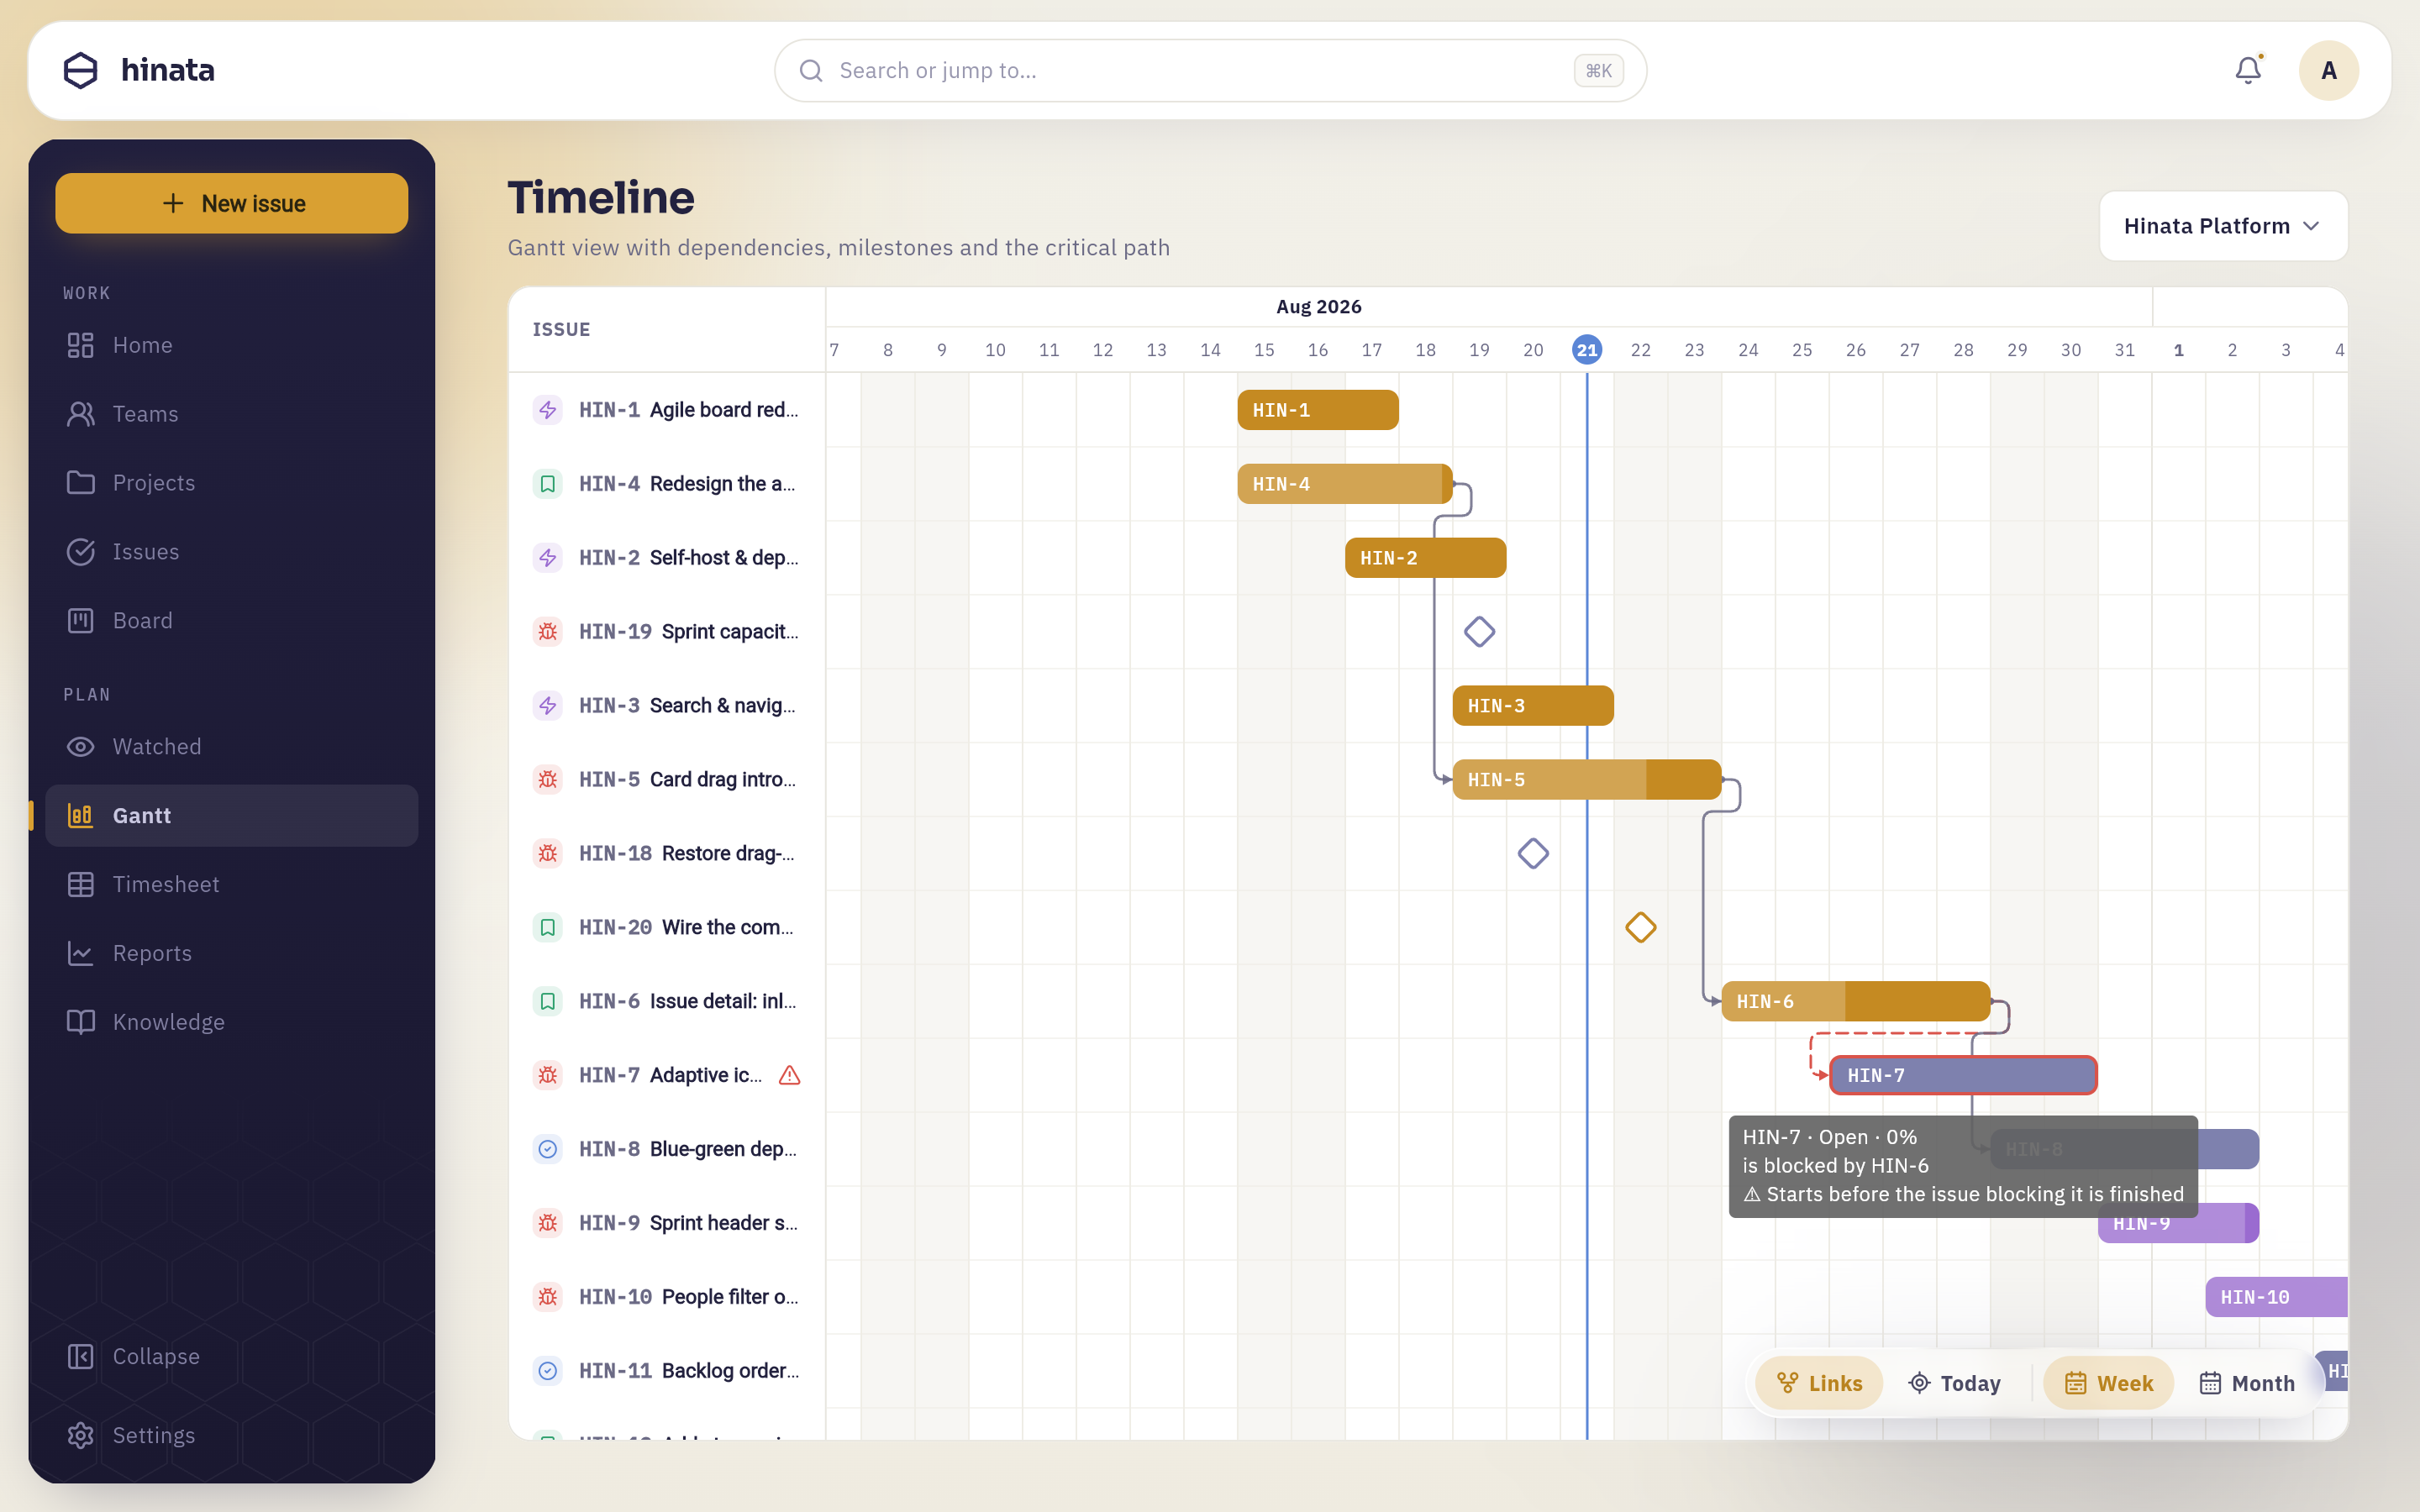 HIN-7 is blocked by HIN-6 and starts before it ends. Four signals say so at once: the red dashed connector, the red outline on HIN-7's bar, the warning triangle beside HIN-7 in the frozen issue column, and the hover tooltip — "is blocked by HIN-6 · Starts before the issue blocking it is finished". The Links panel counts the same conflict.
There are only two honest fixes, and Hinata deliberately makes neither of them for you: move the dates so the blocked issue starts after its blocker finishes, or decide the dependency was not real and remove the link. Silently rescheduling somebody's issue would be the third option, and it is the one that loses trust.
The critical path#
Turn on Critical path and the timeline highlights the longest chain of blocking dependencies in the project — measured in days, from the first issue in the chain to the last.
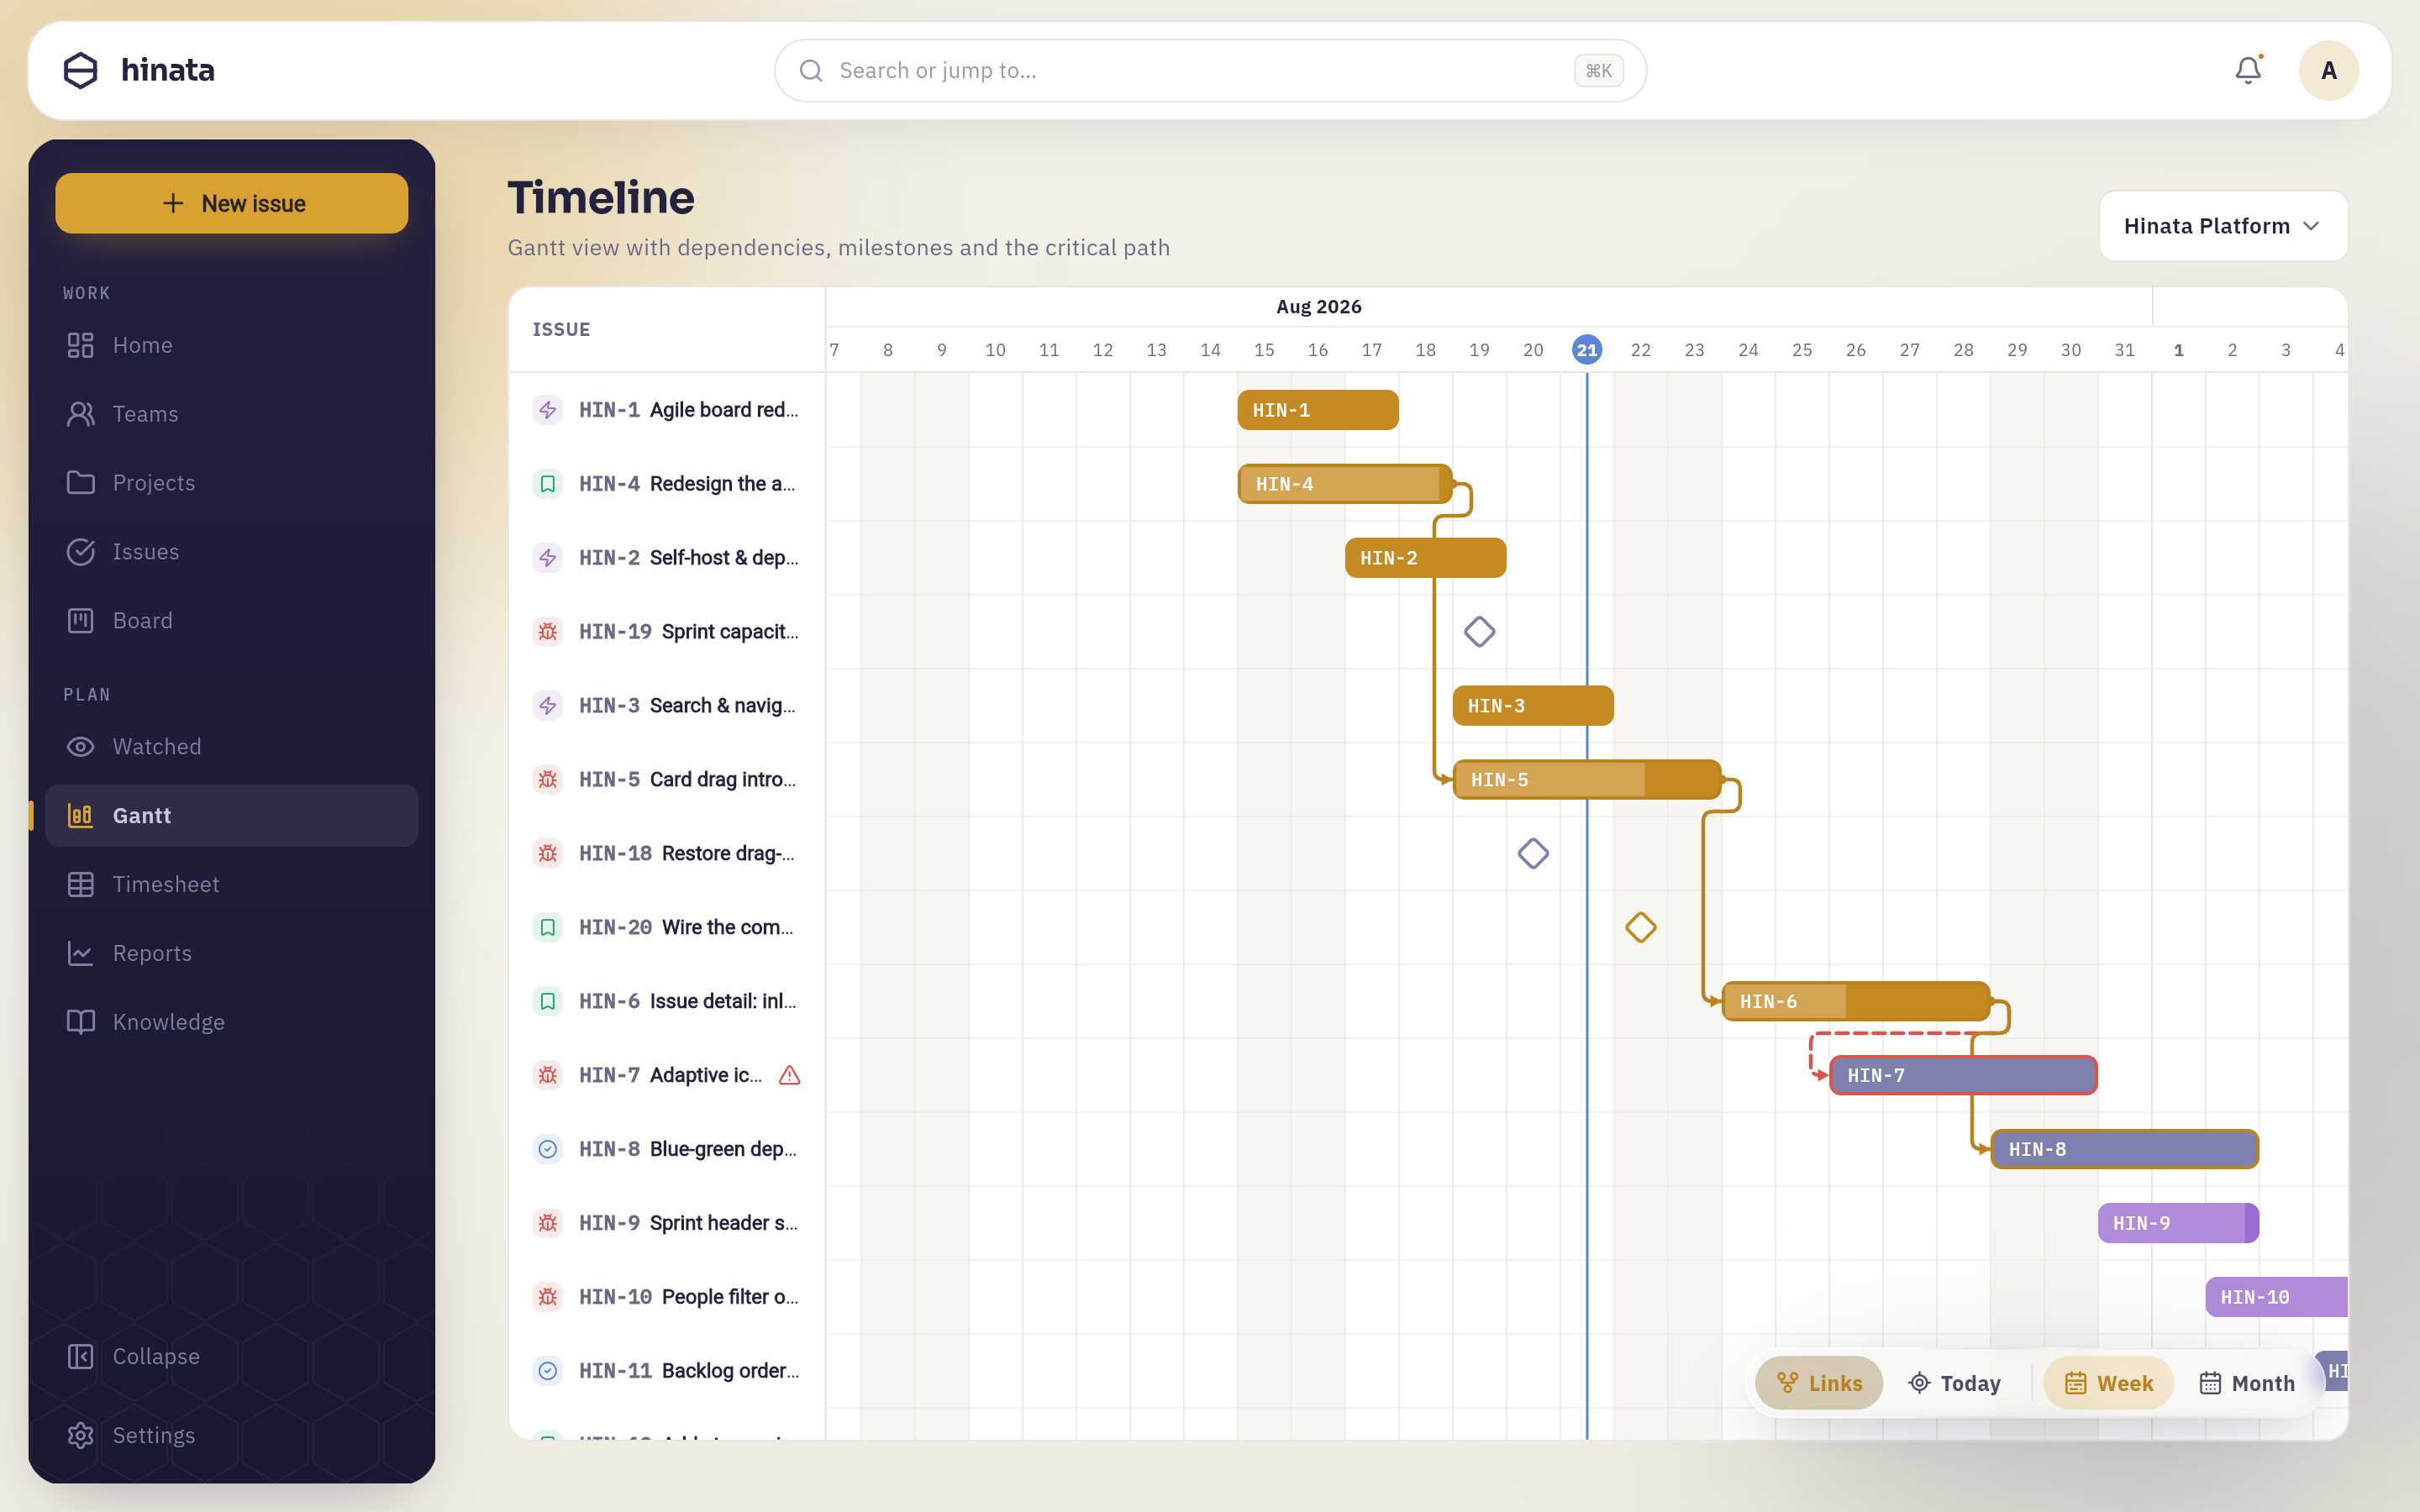 The same chart with Critical path switched on: the connectors along HIN-4 → HIN-2 → HIN-5 → HIN-6 → HIN-7 → HIN-8 thicken and turn amber, while every link off that chain stays thin and grey.
What that ring means in practice: these issues have no slack. If one of them slips by a day, the end of the whole chain slips by a day, because there is nothing to absorb it. Issues off the critical path have some room; issues on it do not. It is the shortest answer to "where should the extra pair of hands go?"
The path is only as good as the links
The critical path is computed from the blocking links between issues that are on this chart. Work nobody linked, and work nobody dated, is invisible to it. If the answer looks wrong, the missing piece is usually a dependency that lives in someone's head rather than in the issue.
Focus one issue#
Click or tap a bar and it is pinned: that issue and everything one link away from it stay bright, while the rest of the chart dims. It is the fastest way to answer "what is this waiting on, and what is waiting on it" without reading every line.
Every gesture the chart understands, in one place:
| Do this | And you get |
|---|---|
| Click or tap a bar | Pins that issue — it and its linked neighbours stay bright, the rest dim |
| Click or tap it again | Clears the pin |
| Click or tap empty grid | Also clears the pin |
| Hover a bar | A tooltip with the key, state, progress, every relationship and any conflict |
| Long-press or double-click a bar | Opens the issue |
| Click a title in the left-hand column | Opens the issue |
| Drag the chart | Scrolls through time, or down through issues |
The issue opens over the timeline rather than replacing it, so closing it puts you back on the same project, the same zoom and the same scroll position — and any date you changed is already redrawn.
The board's Timeline view#
A Kanban board's Timeline view is the same chart, built from the board's own issues:
- Everything currently on the board appears, filtered exactly as you have filtered the board.
- Issues without dates are not dropped — they are listed underneath the grid, marked as having no start or due date, so a planning session can see what still needs scheduling.
- Sub-tasks are left off. They are detail that belongs inside their parent, and on a roadmap they add noise rather than information.
- Dependencies, conflicts, milestones and the critical path all read exactly as they do here.
Plan a release, start to finish#
Here is the whole page as one worked sequence. Say you are shipping in six weeks.
- Create the milestone first. Make an issue called Release 2.4 ships, give it only a due date — the ship day — and no start date. It appears as a diamond on that day, and now everything else has something to aim at.
- Date the work. Go through the issues that have to be done by then and give each a start and a due date. Bars start appearing. Do not worry yet about whether they fit.
- Link what genuinely waits. For each pair where one really cannot begin until the other is finished, add a is blocked by link. Link the last piece of work to the milestone too, so the diamond is connected to the chain rather than floating next to it.
- Look for red. Open Links and read the conflict count. Every conflict is a promise the calendar cannot keep — fix each one by moving a date or by admitting the dependency was optional.
- Turn on the critical path. The amber chain is the sequence that decides your ship date. Anything on it that has no owner, or an owner with three other amber issues, is the risk you now know about six weeks early.
- Check it in Month zoom. Step back and look at the shape. A wall of bars in the final week is the classic sign that the estimates are optimistic, and it is much easier to see at a glance than to argue from a list.
- Come back to it. Because the chart is generated from the issues, revisiting it costs nothing. As dates move and work gets logged, the bars fill in and the conflicts appear on their own.
Why isn't my issue on the timeline?#
Almost always one of five things:
- It has no dates. The timeline needs a start date, a due date or both. This is by far the most common cause.
- It has been archived. Archived issues are left off deliberately. Restore it and it comes back.
- You are looking at another project. The Gantt page shows one project at a time — check the picker in the top-right.
- It is a sub-task on a board's Timeline view. Sub-tasks are omitted there. They do appear on the Gantt page if they are dated.
- You are on a board's Timeline and a filter is hiding it. That view respects the board's filters; clear them and look again.
And if the issue is there but a connector is missing, the reason is nearly always that the issue at the other end of the link has no dates, so there is nothing to draw the arrow to.
What the timeline will not do#
Being clear about the edges saves you looking for a control that is not there:
- You cannot drag a bar to reschedule it. Dates are edited on the issue, where the change is recorded in its history and everyone watching it hears about it. Opening the issue from the chart takes one long-press.
- It shows one project at a time. Use the project picker to switch; for a cross-project view, put the projects on one board and use that board's Timeline.
- It plans nothing for you. No automatic levelling, no rescheduling to resolve a conflict, no dates invented from estimates. The chart shows what your team actually wrote down — including, usefully, where they wrote down two contradictory things.
Where to go next#
- Working with issues — dates, links and hierarchy on the issue itself.
- Boards & sprints — the same work by state, and the board's own Timeline view.
- Tracking your time — logging effort, which is what fills the progress in a bar.
- Reports & dashboard — how the plan compares with what actually happened.